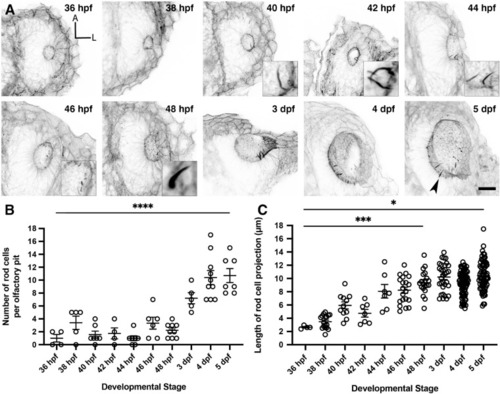
Olfactory rod cells arise early during zebrafish olfactory pit development. (A) Maximum intensity projections of Airyscan confocal images showing the wild-type development of olfactory pit and olfactory rod cells at various embryonic and larval stages, using Alexa-phalloidin as a marker; anterior “A” to the top, lateral “L” to the right. Grayscale values from the original fluorescence image have been inverted. Arrowhead marks one example olfactory rod. Scale bar = 20 μm. Selected inserts show olfactory rods at higher magnification. (B) The change in number of olfactory rod cells per olfactory pit during embryonic development—36 hpf (N of olfactory pits = 4), 38 hpf (N = 5), 40 hpf (N = 7), 42 hpf (N = 4), 44 hpf (N = 7), 46 hpf (N = 6), 48 hpf (N = 9), 3 dpf (N = 5), 4 dpf (N = 10), and 5 dpf (N = 7). Bars indicate mean ± SEM for each stage. Linear regression analysis; * * * * indicates P < 0.0001. (C) The change in lengths of olfactory rod cell projections during embryonic development—36 hpf (N of olfactory pits = 2, n of olfactory rods = 4), 38 hpf (N = 4, n = 17), 40 hpf (N = 6, n = 11), 42 hpf (N = 3, n = 7), 44 hpf (N = 5, n = 7), 46 hpf (N = 6, n = 20), 48 hpf (N = 9, n = 20), 3 dpf (N = 5, n = 32), 4 dpf (N = 10, n = 82), and 5 dpf (N = 8, n = 71). Bars indicate mean ± S.E.M. for each stage. Linear regression analysis; * indicates P = 0.0251, * * * indicates P = 0.0009.
|
