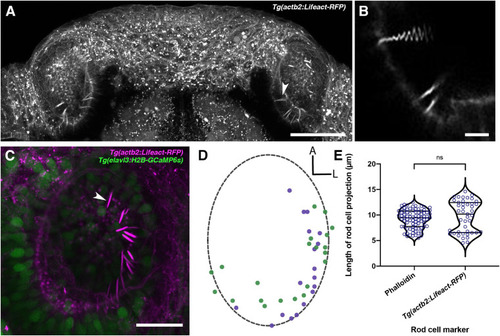
Olfactory rods are labelled in the olfactory epithelia of live zebrafish larvae by the Tg(actb2:Lifeact-RFP) transgene. (A) Maximum intensity projection of dorsal view image of the olfactory pits of a live 6 dpf Tg(actb2:Lifeact-RFP) transgenic larva; anterior to the top. Arrowhead marks one example olfactory rod positive for the Lifeact-RFP transgene. Scale bar = 50 μm. (B) Enlargement of olfactory rods in panel (A) [arrowhead in panel (A)] oscillating during raster-scanned image capture. (Raster scanning was performed from top to bottom in the image, as it has been rotated 90° clockwise) (see Supplementary Movie 2). Scale bar = 5 μm. (C) Maximum intensity projection image of a live 4 dpf Tg(actb2:Lifeact-RFP);Tg(elavl3:H2B-GCaMP6s) double-transgenic larval olfactory pit; anterior to the top, lateral to the right. Arrowhead marks one example olfactory rod positive for the Lifeact-RFP transgene (magenta). Neuronal nuclei are labelled in green. Larvae were fully mounted in agarose, so olfactory rods were not moving. Scale bar = 20 μm (see Supplementary Movie 1). (D) A map of the positions of olfactory rod cell projection bases in olfactory pits of 4 dpf Tg(actb2:Lifeact-RFP);Tg(elavl3:H2B-GCaMP6s) double-transgenic larvae (N of olfactory pits = 2), based on 2D maximum intensity projections of confocal images; anterior “A” to the top, lateral “L” to the right. One dot represents one olfactory rod. Different coloured dots represent olfactory rods from different larvae, with purple corresponding to panel (C). (Compare with Figure 1E). (E) A quantitative comparison of the lengths of olfactory rod cell projections in fixed larvae, using Alexa-phalloidin as a marker (N = 10, n of olfactory rods = 82) versus live larvae, using Lifeact-RFP as a marker (N = 2, n = 43). Violin plot; bars indicate the median and lower and upper quartiles for each group. Mann-Whitney U test; ns, not significant (P = 0.232).
|
