IMAGE

FIGURE 2

ID
ZDB-IMAGE-210319-94
Source
Figures for Cheung et al., 2021
Image
Figure Caption

FIGURE 2

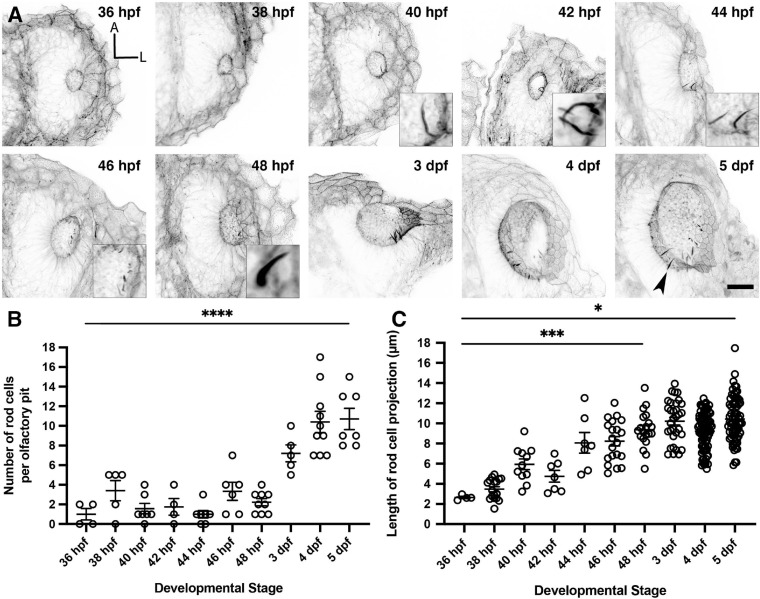
Olfactory rod cells arise early during zebrafish olfactory pit development. (A) Maximum intensity projections of Airyscan confocal images showing the wild-type development of olfactory pit and olfactory rod cells at various embryonic and larval stages, using Alexa-phalloidin as a marker; anterior “A” to the top, lateral “L” to the right. Grayscale values from the original fluorescence image have been inverted. Arrowhead marks one example olfactory rod. Scale bar = 20 μm. Selected inserts show olfactory rods at higher magnification. (B) The change in number of olfactory rod cells per olfactory pit during embryonic development—36 hpf (N of olfactory pits = 4), 38 hpf (N = 5), 40 hpf (N = 7), 42 hpf (N = 4), 44 hpf (N = 7), 46 hpf (N = 6), 48 hpf (N = 9), 3 dpf (N = 5), 4 dpf (N = 10), and 5 dpf (N = 7). Bars indicate mean ± SEM for each stage. Linear regression analysis; * * * * indicates P < 0.0001. (C) The change in lengths of olfactory rod cell projections during embryonic development—36 hpf (N of olfactory pits = 2, n of olfactory rods = 4), 38 hpf (N = 4, n = 17), 40 hpf (N = 6, n = 11), 42 hpf (N = 3, n = 7), 44 hpf (N = 5, n = 7), 46 hpf (N = 6, n = 20), 48 hpf (N = 9, n = 20), 3 dpf (N = 5, n = 32), 4 dpf (N = 10, n = 82), and 5 dpf (N = 8, n = 71). Bars indicate mean ± S.E.M. for each stage. Linear regression analysis; * indicates P = 0.0251, * * * indicates P = 0.0009.

Acknowledgments
This image is the copyrighted work of the attributed author or publisher, and ZFIN has permission only to display this image to its users. Additional permissions should be obtained from the applicable author or publisher of the image. Full text @ Front. Physiol.