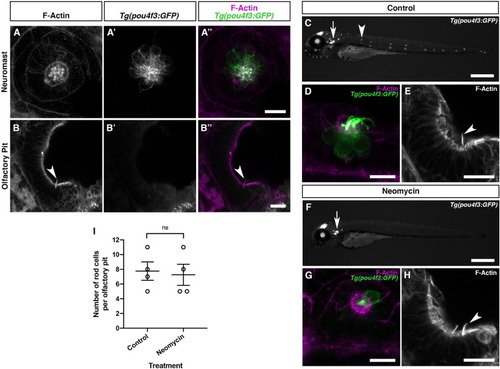
Olfactory rod cells in the zebrafish olfactory epithelium are not hair-cell-like. (A–A″) Maximum intensity projection of Airyscan confocal image of Alexa-phalloidin signal (A), Tg(pou4f3:GFP) signal (A′), and merged signals (A″) in a cranial neuromast of a 5 dpf larva. Scale bar = 10 μm. (B–B″) Airyscan confocal image of Alexa-phalloidin signal (B), Tg(pou4f3:GFP) signal (B′), and merged signals (B″) in an olfactory pit of a 5 dpf larva; anterior to the top, lateral to the right. Arrowhead marks one olfactory rod. Scale bar = 20 μm. (C,F) Widefield imaging of 3 dpf Tg(pou4f3:GFP) larvae showing the damaging effects of 500 μM neomycin treatment for 60 min on lateral line neuromast hair cells. Fluorescence is lost or greatly reduced in both trunk (arrowhead) and cranial neuromasts, whereas fluorescence in hair cells of the inner ear maculae and cristae (arrow) is unaffected. Scale bars = 500 μm. (D,G) Maximum intensity projections of Airyscan confocal images showing the damaging effects of 500 μM neomycin treatment for 60 min on hair cells in a cranial neuromast of a 3 dpf larva, using Tg(pou4f3:GFP) (green) and Alexa-phalloidin (magenta) as markers. Scale bars = 10 μm. (E,H) Maximum intensity projections of Airyscan confocal images showing no effect of 500 μM neomycin treatment for 60 min on olfactory rods, using Alexa-phalloidin as a marker; anterior to the top, lateral to the right. Arrowheads mark olfactory rods. Scale bars = 20 μm. (I) The number of olfactory rod cell projections per olfactory pit of 3 dpf Tg(pou4f3:GFP) larvae after 500 μM neomycin treatment for 60 min (N of olfactory pits = 4), compared with an untreated group (N = 4). Bars indicate mean ± SEM. Welch’s unpaired two-tailed t-test; ns, not significant (P = 0.8018).
|

