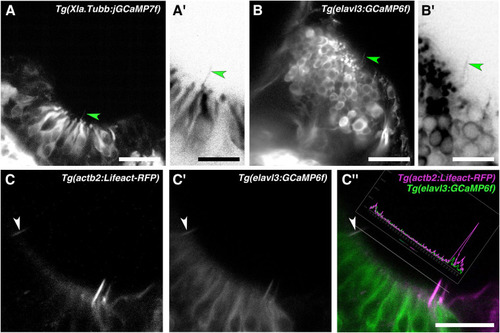
Olfactory rod cells are labelled by the cytoplasmic neuronal markers Tg(Xla.Tubb:jGCaMP7f) and Tg(elavl3:GCaMP6f). (A) Olfactory pit of a 4 dpf Tg(Xla.Tubb:jGCaMP7f) larva; anterior to the top, lateral to the right. Arrowhead marks one example olfactory rod, albeit faintly labelled. Scale bar = 20 μm. (A′) Enlargement of olfactory rod marked by arrowhead in panel (A) (grayscale values inverted). Scale bar = 10 μm. (B) Olfactory pit of a 5 dpf Tg(elavl3:GCaMP6f) larva; anterior to the top, lateral to the right. Arrowhead marks one example olfactory rod, albeit faintly labelled. Scale bar = 20 μm. (B′) Enlargement of olfactory rod marked by arrowhead in panel (B) (grayscale values inverted). Scale bar = 10 μm. (C–C″) Lifeact-RFP signal (C), GCaMP6f signal (C′), and merged signals (C″) in an olfactory pit of a 5 dpf Tg(elavl3:GCaMP6f);Tg(actb2:Lifeact-RFP) double-transgenic larva; anterior to the top, lateral to the right. The trace shows levels of red and green fluorescence along the dotted line, which passes through three olfactory rods positive for both Lifeact-RFP and GCaMP6f. The olfactory rod highlighted with the arrowhead shows similar levels of fluorescence in both the red and green channels. Scale bar = 20 μm.
|
