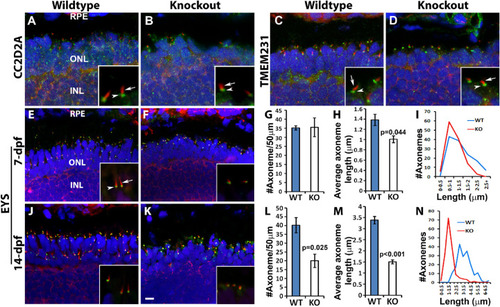
Length of photoreceptor axonemes was reduced in knockout zebrafish. Cryosections were immunostained with axoneme marker, acetylated α-tubulin (red), and connecting ciliary region markers CC2D2A, TMEM231, and EYS (green). Sections were then counterstained with DAPI to visualize nuclei. (A, B) Acetylated α-tubulin (red, arrow) and CC2D2A (green, arrowhead) double immuno-labeling of 7dpf wildtype and tmem216snyΔ175 homozygous retina. (C, D) Acetylated α-tubulin (red, arrow) and TMEM231 (green, arrowhead) double immuno-labeling of 7dpf wildtype and tmem216snyΔ175 homozygous retina. (E, F) Acetylated α-tubulin (red, arrow) and EYS (green, arrowhead) double immuno-labeling of 7dpf wildtype and tmem216snyΔ175 homozygous retina. Note the reduction in axoneme length in the knockout zebrafish (F, inset). (J, K) Acetylated α-tubulin and EYS double immuno-labeling of 14-dpf wildtype and tmem216snyΔ175 homozygous retina. (G–I) Quantification of 7-dpf axoneme number and length. Note the reduction in average axoneme length (n = 3, Student's t-test) and the shift of axoneme lengths toward lower length bins in the knockout. (L–N) Quantification of 14-dpf axoneme number and length (n = 3, Student's t-test). Scale bar in K: 6 µm for A–F, J, and K; 1.5 µm for insets.
|
