IMAGE

Figure 8.

ID
ZDB-IMAGE-200829-55
Antibodies
Source
Figures for Liu et al., 2020
Image
Figure Caption

Figure 8.

Length of photoreceptor axonemes was reduced in knockout zebrafish. Cryosections were immunostained with axoneme marker, acetylated α-tubulin (
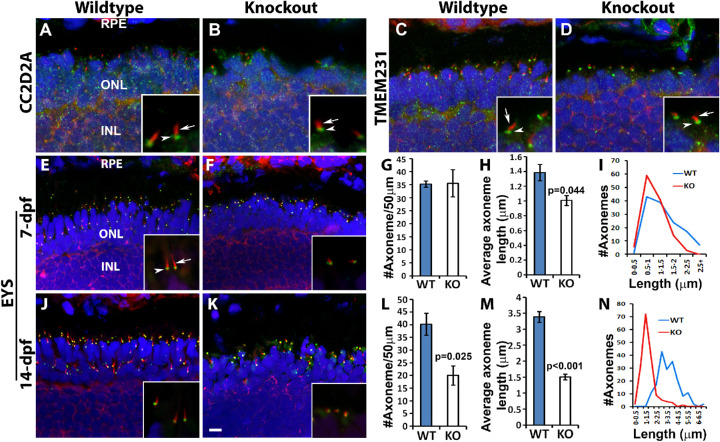
red), and connecting ciliary region markers CC2D2A, TMEM231, and EYS (green). Sections were then counterstained with DAPI to visualize nuclei. (A, B) Acetylated α-tubulin (red, arrow) and CC2D2A (green, arrowhead) double immuno-labeling of 7dpf wildtype and tmem216snyΔ175 homozygous retina. (C, D) Acetylated α-tubulin (red, arrow) and TMEM231 (green, arrowhead) double immuno-labeling of 7dpf wildtype and tmem216snyΔ175 homozygous retina. (E, F) Acetylated α-tubulin (red, arrow) and EYS (green, arrowhead) double immuno-labeling of 7dpf wildtype and tmem216snyΔ175 homozygous retina. Note the reduction in axoneme length in the knockout zebrafish (F, inset). (J, K) Acetylated α-tubulin and EYS double immuno-labeling of 14-dpf wildtype and tmem216snyΔ175 homozygous retina. (G–I) Quantification of 7-dpf axoneme number and length. Note the reduction in average axoneme length (n = 3, Student's t-test) and the shift of axoneme lengths toward lower length bins in the knockout. (L–N) Quantification of 14-dpf axoneme number and length (n = 3, Student's t-test). Scale bar in K: 6 µm for A–F, J, and K; 1.5 µm for insets.

Figure Data
Acknowledgments
This image is the copyrighted work of the attributed author or publisher, and ZFIN has permission only to display this image to its users. Additional permissions should be obtained from the applicable author or publisher of the image. Full text @ Invest. Ophthalmol. Vis. Sci.