|
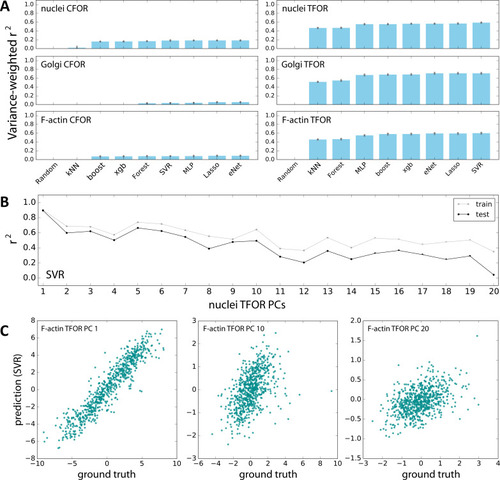
Evaluation of Machine Learning Algorithms for Feature Space Atlas Mapping.(A) Performance of different algorithms at predicting the embedded feature spaces of different secondary marker channels from embeddings of cell shape. The left column contains predictions from the cell shape CFOR space to subcellular structure CFOR spaces, the right column from cell shape TFOR space to subcellular structure TFOR spaces. Performance is quantified as variance-weighted average of r-squared values across target dimensions. Gray dots are the results from 3-fold cross-validation, blue bars are averages. The algorithms evaluated are a random assignment control (random), k Nearest Neighbors (kNN), the scikit-learn implementation of gradient boosting (boost), xgboost (xgb), random forest regression (forest), support vector regression (SVR), multi-layer perceptrons (MLP), multi-task Lasso regression (Lasso), and multi-task elastic nets (eNet). Note that TFOR predictions work far better than CFOR predictions, which may indicate that pure shape information is insufficient to predict key features of intracellular protein distributions, possibly because information on tissue context is lost. (B) Both for training and prediction, PCA-transformed feature spaces were used. Here, prediction quality is shown for each PC of an example channel, illustrating that high-variance PCs lend themselves to more accurate prediction than low-variance components, as expected given that the latter encode less meaningful variation and more noise. (C) Examples showing the correlation of resulting predictions with ground truths, again illustrating that high-variance PCs (left) can be fitted better than low-variance PCs (right).
|