
Figure 7
- ID
- ZDB-FIG-200612-18
- Publication
- Hartmann et al., 2020 - An image-based data-driven analysis of cellular architecture in a developing tissue
- Other Figures
- All Figure Page
- Back to All Figure Page
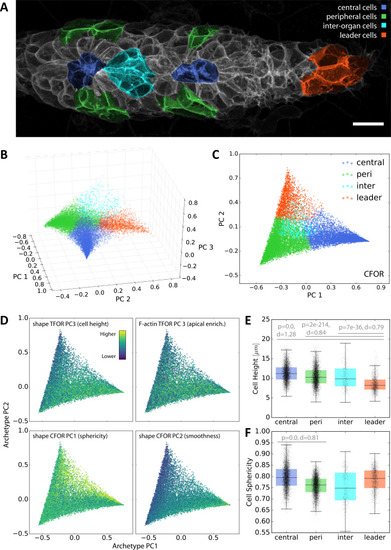
(A) A maximum z-projected example stack with colors highlighting different conceptual archetypes in the pLLP that have been manually annotated. (B) A low-dimensional archetype space resulting from a PCA of the SVC prediction probabilities (with the SVC having been trained on CFOR shape features). Cells are placed according to how similar they are to each archetype, with those at the corners of the tetrahedron belonging strictly to the corresponding archetype and those in between exhibiting an intermediate morphology. (C) Since inter-organ cells are not morphologically distinct enough at this stage (see Figure 7—figure supplement 1), the archetype space can be reduced to 2D without much loss of information. (D) Scatter plots of the 2D archetype space with additional information from the cellular shape space and from the protein distribution atlas superimposed in color. (E–F) Boxplots showing data grouped by predicted archetype labels. This form of grouping allows statistical analysis, showing that leader cells are flatter than any other class of follower cells (E) and that central rosette cells are more spherical than peripheral rosette cells (F). Whiskers are 5th/95th percentiles, p-values are computed with a two-sided Mann-Whitney U-test, and Cohen's d is given as an estimate of effect size. |