
Figure 2
- ID
- ZDB-FIG-200612-14
- Publication
- Hartmann et al., 2020 - An image-based data-driven analysis of cellular architecture in a developing tissue
- Other Figures
- All Figure Page
- Back to All Figure Page
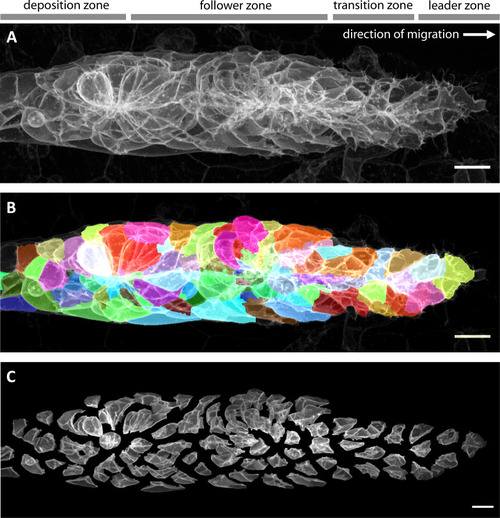
(A) Maximum z-projection of a deconvolved 3D volume of the pLLP acquired using the LSM880 AiryScan FAST mode. (B) The same primordium shown with a semi-transparent color overlay of the corresponding single-cell segmentation. (C) Expanded view of the same primordium; individual segmented cells have been shifted apart without being rescaled or deformed, revealing their individual shapes within the collective. Note that the segmentation faithfully recapitulates the diversity of cell shapes within the pLLP, with the exception of fine protrusions. Since the protrusions of follower cells are often impossible to detect against the membranes of the cells ahead of them, we decided not to include fine protrusions in our analysis. All scale bars: 10 μm. |