FIGURE

Figure 3—figure supplement 2.

ID
ZDB-FIG-200612-17
Publication
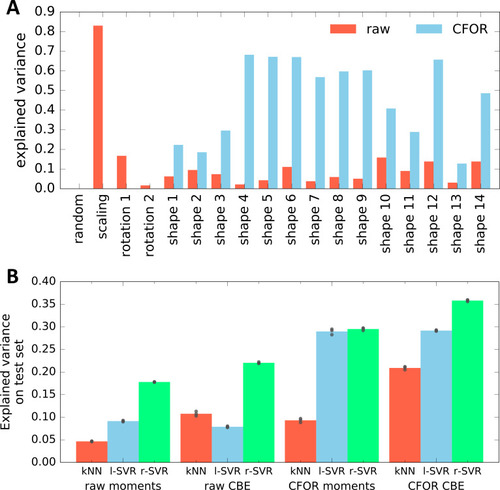
Hartmann et al., 2020 - An image-based data-driven analysis of cellular architecture in a developing tissue
Other Figures
All Figure Page
Back to All Figure Page
Figure 3—figure supplement 2.

Evaluation of the Expressiveness of CBE Embeddings With and Without Cell Frame of Reference (CFOR) Normalization.

(A) Performance in predicting different generative parameters of point clouds in a synthetic dataset from either a raw or a size- and rotation-corrected (cell frame of reference, CFOR) embedding. As expected, CFOR normalization removes all information on cloud size ('scaling') and orientation ('rotation' 1–2). Interestingly, removing this information allows the regressor to perform far better when it comes to the shape parameters of the point cloud ('shape' 1–14). The 'random' parameter is a random Gaussian distribution and serves as a negative control. The regressor used is a Support Vector Regressor (SVR) with an RBF-kernel. (B) Evaluation of CBE compared to an alternative embedding strategy based on moments. Shown is how well the parameters used to synthetically generate point clouds can be predicted from embeddings of said clouds using different regression models (kNN: k-Nearest Neighbor regressor, l-SVR: linear Support Vector Regressor, r-SVR: RBF-kernel Support Vector Regressor). Black dots indicate results of 3-fold cross-validation, bars indicate the mean. Moments-based embedding is outperformed by CBE in all cases except with linear SVR, where the results are similar.

Expression Data

Expression Detail
Antibody Labeling
Phenotype Data

Phenotype Detail
Acknowledgments
This image is the copyrighted work of the attributed author or publisher, and ZFIN has permission only to display this image to its users. Additional permissions should be obtained from the applicable author or publisher of the image. Full text @ Elife