
Figure 5
- ID
- ZDB-FIG-200612-20
- Publication
- Hartmann et al., 2020 - An image-based data-driven analysis of cellular architecture in a developing tissue
- Other Figures
- All Figure Page
- Back to All Figure Page
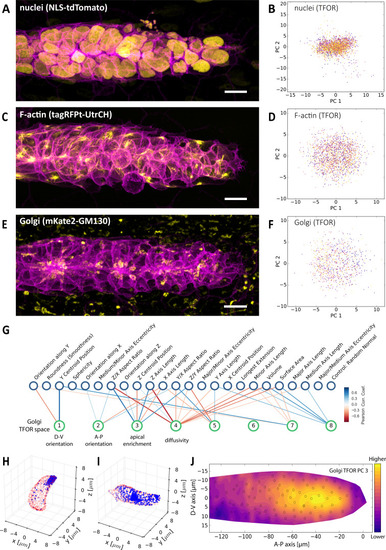
(A, C, E) Maximum z-projections of two-color stacks showing the membrane in magenta and one of three subcellular structures in yellow. (B, D, F) Tissue frame of reference (TFOR) CBE embeddings corresponding to the three structures shown in A, C and E. The different colors of points indicate different primordia. The three structures are nuclei (N = 20, n = 2528) (A–B), F-actin (N = 19, n = 1876) (C–D) and the Golgi apparatus (N = 11, n = 866) (E–F). (G) Bigraph showing correlations between the Golgi's embedded features and our engineered cells shape features (see Supplementary file 2). The first two Golgi TFOR PCs match those found in the cell shape TFOR space (see Figure 4E) whereas PCs 3 and 4 are specific to the Golgi. For technical details see the legend of Figure 4E. (H–I) Point cloud renderings showing the distribution of Golgi signal (blue, membranes in red) in two example cells, one with a high value in the Golgi's TFOR PC 3 (H) and one with a low value (I), illustrating that PC three captures apical enrichment of the Golgi. (J) Consensus tissue map for Golgi PC 3 (apical enrichment), showing increased values behind the leader zone. For technical details see the legend of Figure 4G. |