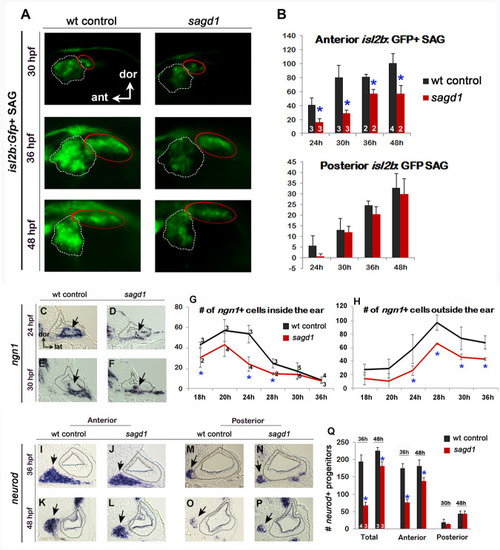
(A) Lateral views of isl2b:Gfp+ SAG neurons in live wild-type (wt) embryos and sagd1mutants at the indicated times. The anterior/vestibular portion of the SAG (outlined in white) is deficient in sagd1 mutants, whereas the posterior SAG (outlined in red) appears normal. (B) Number (mean and s.d.) of isl2b:Gfp+ anterior neurons and posterior neurons in wild-type and sagd1 embryos at the times indicated. Sample sizes are indicated. Asterisks, here and in subsequent figures, indicate significant differences (p<0.05) from wild-type controls. (C–F) Cross-sections through the anterior/vestibular portion of the otic vesicle (outlined) showing expression of ngn1 in wild-type embryos and sagd1 mutants at 24 and 30 hpf. (G, H) Mean and standard deviation of ngn1+ cells in the floor of the otic vesicle (G) and in recently delaminated SAG neuroblasts outside the otic vesicle (H), as counted from serial sections. (I–P) Cross-sections through the anterior/vestibular and posterior/auditory regions of the otic vesicle showing expression of neurod in transit-amplifying SAG neuroblasts at 36 and 48 hpf. (Q) Mean and standard deviation of neurod+ SAG neuroblasts at 30 and 48 hpf counted from serial sections. Sample sizes are indicated (B, G, Q).