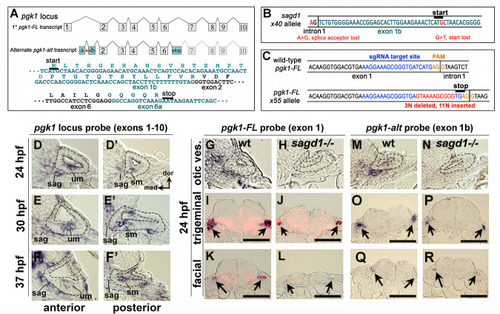
(A) Exon-intron structure of the primary full-length pgk1 transcript (pgk1-FL) and alternate transcript (pgk1-alt) arising from an independent transcription start site containing two novel exons (1a and 1b) that splice in-frame to exon 2, and a third novel exon (6a) containing a stop codon. The nucleotide and peptide sequences of exons 1b and 6a are shown. Relative positions of the lesions in sagd1 affecting exon 1b are indicated (red asterisks). (B) Nucleotide sequence near the 5’ end of exon 1b showing the SNPs detected in sagd1 (red font). (C) Nucleotide sequence of pgk1-FL showing the sgRNA target site (blue font) and the altered sequence of the x55 mutant allele (red font), which introduces a premature stop codon. (D–F’) Cross sections through the otic vesicle (outlined) showing staining with ribo-probe for the entire pgk1 locus (covering both pgk1-FL and pgk1-alt) in wild-type embryos. Note elevated expression in the SAG, utricular macula (um), and saccular macula (sm). (G, H, M, N) Cross sections through the otic vesicle (outlined) in wild-type embryos and sagd1 mutants stained with ribo-probe for exon 1 (pgk1-FL alone) (G, H) or exon 1b (pgk1-alt alone) (M, N). Accumulation of both transcripts is dramatically reduced in sagd1 mutants. (I–L, O–R) Cross sections through the hindbrain (dorsal up) showing expression of pgk1-FL (black) plus neurod (red) (I–L) or pgk1-alt alone (O–R). Arrows indicate positions of the trigeminal and facial ganglia. Scale bar, 100 µm.