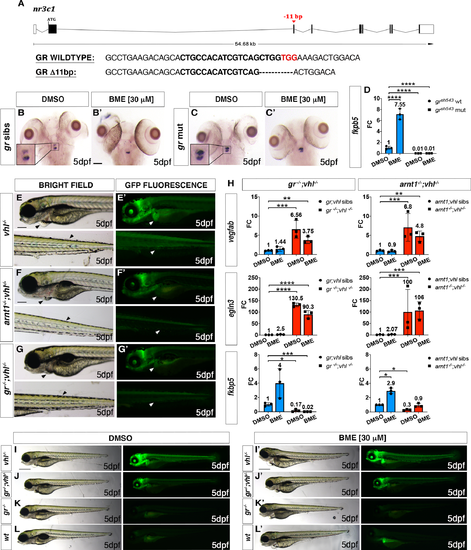
gr mutation partially rescues vhl phenotype. A. Schematic representation of zebrafish gr (nr3c1) gene. Exons are shown as boxes, introns as lines. The red arrowhead shows the position of a -11 bp deletion in exon 3 (encoding the DNA binding domain). gr wt and mutant sequence. CRISPR target site: bold. PAM sequence: red. B-C’. Representative pictures of WISH performed on DMSO and BME [30 μM] treated gr mutant line, at 5 dpf, using pomca as probe. Scale bar 100 μm. gr siblings DMSO treated (n = 30/30 larvae) showed normal expression; gr siblings (n = 29/30 larvae) showed downregulated pomca expression after BME treatment. Both DMSO treated (n = 30/30) and BME treated (n = 30/30) gr-/- larvae showed upregulated pomca expression. D. RTqPCR analysis performed on gr wt (n = 10; 3 repeats) and gr-/- (n = 10; 3 repeats) larvae at 5 dpf, using fkbp5 as probe. Statistical analysis was performed on ΔΔCt values, whereas data are shown as fold change values. Ordinary Two-way ANOVA followed by Dunnett’s multiple comparison test (****P < 0.0001). E-G. Magnified picture of representative gr-/-; vhl-/- larvae compared to arnt1-/-;vhl-/- and vhl-/- larvae. Both double mutants are characterized by the absence of pericardial oedema, no ectopic extra vasculature at the level of the tail, no bright liver and a reduced brightness in the rest of the body (white and black arrowheads), compared to vhl-/- larvae. Fluorescence, exposure = 2 seconds. Scale bar 200 μm. H. RTqPCR analysis performed both on HIF and GC target genes expression carried out on gr-/-; vhl-/- and sibling at 5 dpf, (n = 10 larvae, per group, in triplicate) compared to arnt1-/-;vhl-/- larvae and siblings, at 5dpd (n = 10 larvae, per group, in triplicate). Both vegfab and egln3 are HIF target genes, whereas fkbp5 is a GC target gene. Statistical analysis was performed on ΔΔCt values, whereas data are shown as fold change values, Ordinary Two-way ANOVA followed by Dunnett’s multiple comparison test. I-L. Representative picture of phenotypic analysis performed on DMSO and BME [30 μM] treated gr+/-; vhl+/-(phd3:eGFP) incross-derived 5 dpf larvae (n = 600). All the genotype combinations observed are represented in the figure. Among the 450 GFP+ larvae analysed, 28 showed a partially rescued vhl phenotype which resembled the arnt1’s one. Three experimental repeats. In all panels: *P < 0.05; **P < 0.01; ***P <0.001; ****P < 0.0001. Fluorescence, exposure = 2 seconds. Scale bar 500 μm.
|
