
Fig. s3
- ID
- ZDB-FIG-200520-20
- Publication
- Marchi et al., 2020 - Bidirectional crosstalk between Hypoxia-Inducible Factor and glucocorticoid signalling in zebrafish larvae
- Other Figures
- All Figure Page
- Back to All Figure Page
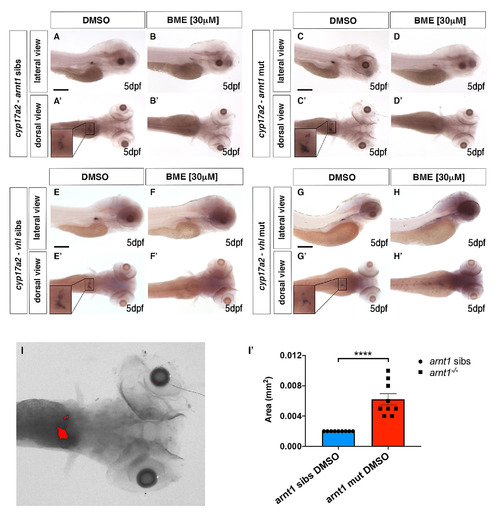
gr-/-; vhl-/- larvae showed a reduced phd3:eGFP brightness and a partially rescued Vhl phenotype. A-D’. Representative pictures of WISH performed on DMSO and BME [30 μM] treated arnt1 mutant line, at 5 dpf, using cyp17a2 as probe. A-A’) arnt1 wt DMSO treated larvae (n = 26/28) showed normal cyp17a2 expression, whereas 2/28 larvae showed a weaker one; B-B’) arnt1 wt BME treated larvae (n = 28/30) showed downregulated cyp17a2 expression, whereas 2/30 larvae showed a normal one. C-C’) In contrast, arnt1-/- DMSO treated larvae (n = 24/28) showed upregulated cyp17a2 expression, whereas 4/28 larvae showed a weaker one. D-D’) arnt1-/- BME treated larvae (n = 25/29) showed downregulated cyp17a2 expression, whereas 4/29, showed a normal one. Chi-square test (****P < 0.0001). Scale bar 200 μm. E-H’. Representative pictures of WISH performed on DMSO and BME [30 μM] treated vhl mutant line, at 5 dpf, using cyp17a2 as probe. E-E’) DMSO treated vhl siblings (n = 18/21) showed normal cyp17a2 expression, whereas 3/21 larvae showed a weaker one; F-F’) BME treated vhl siblings (n = 28/30) showed downregulated cyp17a2 expression, whereas 2/30 larvae showed a normal one. G-G’) On the other hand, vhl-/- DMSO treated larvae (n = 27/28) showed weak cyp17a2 expression, whereas 1/28 larvae showed a normal one. H-H’) vhl-/- BME treated larvae (n = 30/30) showed downregulated cyp17a2 expression. Chi-square test (****P < 0.0001). Scale bar 200 μm. I-I’. Representative picture of the colour threshold area calculation method (ImageJ software’s tool) used to quantify the area occupied by the cyp17a2 WISH staining both in arnt1 siblings (n = 9) and arnt1-/- (n = 9). I’. unpaired t-test (****P <0.0001). |