
Fig. s4
- ID
- ZDB-FIG-200520-21
- Publication
- Marchi et al., 2020 - Bidirectional crosstalk between Hypoxia-Inducible Factor and glucocorticoid signalling in zebrafish larvae
- Other Figures
- All Figure Page
- Back to All Figure Page
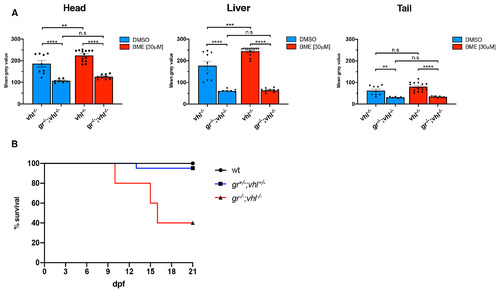
gr-/-; vhl-/- larvae showed a reduced phd3:eGFP brightness and a partially rescued vhl phenotype. A. Statistical analysis performed on mean gray value quantification (at the level of the head, liver and tail), after phenotypic analysis on 5dpf DMSO and BME [30μM] treated gr+/-;vhl+/-(phd3:eGFP) x gr-/-; vhl+/-(phd3:eGFP) derived larvae (n = 600). vhl-/- DMSO treated n = 9 larvae: head 186 ± 15.12 (mean ± s.e.m); liver 177.01 ± 20.85 (mean ± s.e.m); tail 62.34 ± 7.27 (mean ± s.e.m). gr-/-;vhl-/- DMSO treated n = 7 larvae: head 106.96 ± 3.21 (mean ± s.e.m); liver 60.75 ± 2.56 (mean ± s.e.m); tail 30.67 ± 1.27 (mean ± s.e.m). vhl-/- BME treated n = 14 larvae: head 224.32 ± 6.83 (mean ± s.e.m); liver 244.07 ± 5.31 (mean ± s.e.m); tail 80.51 ± 5.49 (mean ± s.e.m). gr-/-;vhl-/- BME treated n = 9 larvae: head 125.85 ± 3.6 (mean ± s.e.m); liver 63.56 ± 2.91 (mean ± s.e.m); tail 33.67 ± 1.02 (mean ± s.e.m). Ordinary One-way ANOVA followed by Sidak’s multiple comparison test (*P < 0.05; **P < 0.01; ***P <0.001; ****P < 0.0001). B. Kaplan-Meier survival curves of the zebrafish gr+/-; vhl+/-(phd3:eGFP) genotype analysed in this study. Time is shown in days. Wild-types n = 20; gr+/-; vhl+/- n = 20; gr-/-; vhl-/-(phd3:eGFP) n = 5. The Log-rank (Mantel-Cox) test was used for statistical analysis. gr-/-; vhl-/-(phd3:eGFP) vs. gr+/-; vhl+/-, ****P < 0.0001; gr-/-; vhl-/-(phd3:eGFP) vs. wt, ****P < 0.0001 |