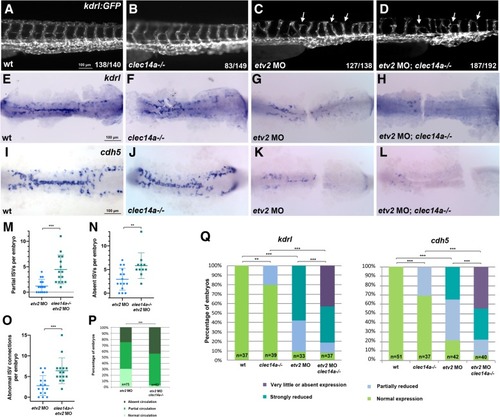
Combinatorial interaction between etv2 and clec14a. a-d ISV sprouting defects (arrowheads) are increased in clec14a mutants injected with the low dose of etv2 MO2 (0.25 ng) compared with etv2 MO injection in wild-type embryos. kdrl: GFP transgenic embryos were imaged at 48 hpf; the trunk region is shown. e-l ISH analysis for kdrl (e-h) and cdh5 expression at the 15–16-somite stages. Flat-mounted embryos; only the trunk and tail region is shown. Note a significant reduction in cdh5 and kdrlexpression in the embryos injected with low dose (0.125 ng) of etv2 MO2. Much greater reduction is observed in etv2 MO; clec14a−/− embryos. m-o The number of partial (m) or absent (n) ISVs per embryo and abnormal ISV connections per embryo (o) in wild-type kdrl: GFP or clec14a−/−; kdrl: GFP embryos at 48 hpf which were injected with 0.25 ng of etv2 MO. 12–15 embryos were analyzed for ISV defects. ***p < 0.001, t-Student’s test. p Percentage of embryos with affected blood circulation at 48 hpf. All wild-type control and clec14a−/− embryos had normal blood circulation (not shown). To calculate statistical significance, embryos were compared with normal or defective circulation (combined partial and absent circulation categories) using Fischer’s exact test, ***p < 0.001. q Percentage of embryos with normal or reduced kdrl and cdh5 expression. Statistical significance was calculated for wild-type versus clec14a−/− and etv2 MO embryos using normal and reduced expression categories (all categories with reduced expression were combined), and for etv2 MO; clec14a−/− embryos versus clec14a−/− and etv2MO embryos using very little or absent expression categories (normal, partially and strongly reduced expression categories were combined). ** p < 0.01, *** p < 0.001, Fisher’s exact test. Data were combined from two independent experiments
|
