|
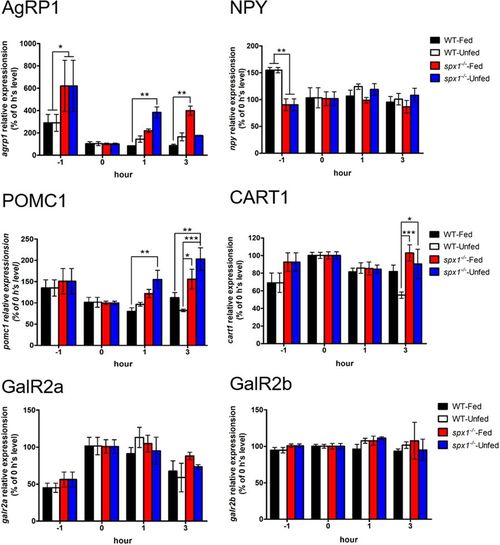
Gene expression analysis of neuropeptides and receptors in the hypothalamus in response to feeding. Quantitative PCR analysis is used to measure mRNA levels of AgRP1 and NPY (upper panel), POMC1 and CART1 (middle panel), GalR2a and GalR2b (lower panel) in WT and spx1 −/− zebrafish at 1 h, 0 h before feeding, 1 h and 3 h after feeding. Expression of elongation factor 1 alpha is used to normalize all samples. All relative expressions are represented as the ratio to the 0 h level respectively. Data were obtained in triplicate and are represented as mean ± s.e.m. (n = 3). *P < 0.05; **P < 0.01; ***P < 0.001 by two-way ANOVA with Bonferroni’s post hoc test.
|