
FIGURE
Fig. 5
- ID
- ZDB-FIG-190527-3
- Publication
- Zheng et al., 2017 - Spexin Suppress Food Intake in Zebrafish: Evidence from Gene Knockout Study
- Other Figures
- All Figure Page
- Back to All Figure Page
Fig. 5
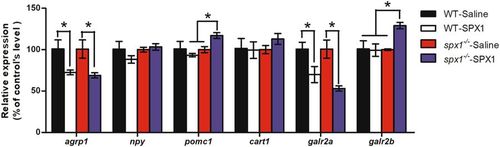
Gene expression analysis of neuropeptides and receptors in the hypothalamus in response to SPX1 intracranial administration. Quantitative PCR analysis is used to measure mRNA levels of WT and spx1 −/− zebrafish. Expression of elongation factor 1 alpha is used to normalize all samples. All relative expressions are represented as the ratio to the saline control. Values are means ± s.e.m. (n = 3). *P < 0.05 by one-way ANOVA with Bonferroni’s post hoc test. |
Expression Data
Expression Detail
Antibody Labeling
Phenotype Data
Phenotype Detail
Acknowledgments
This image is the copyrighted work of the attributed author or publisher, and
ZFIN has permission only to display this image to its users.
Additional permissions should be obtained from the applicable author or publisher of the image.
Full text @ Sci. Rep.