
FIGURE
Fig. 6
- ID
- ZDB-FIG-190527-4
- Publication
- Zheng et al., 2017 - Spexin Suppress Food Intake in Zebrafish: Evidence from Gene Knockout Study
- Other Figures
- All Figure Page
- Back to All Figure Page
Fig. 6
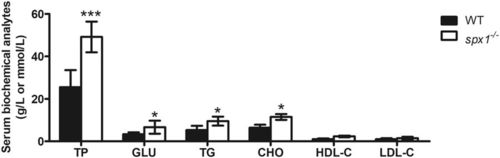
Serum biochemical analytes level in WT and spx1 −/− zebrafish. For each sample, serum from 10 to 20 fishes was mixed as a pool. Data are represented as means ± s.d. (n = 5). *P < 0.05; ***P < 0.001 by Student’s t test (versus corresponding WT group at each time point). TP, total protein (g/L); GLU, glucose (mmol/L); TG, triacylglycerol (mmol/L); CHO, cholesterol (mmol/L); HDL-C, high density lipoprotein cholesterol (mmol/L); LDL-C, low density lipoprotein cholesterol (mmol/L). |
Expression Data
Expression Detail
Antibody Labeling
Phenotype Data
| Fish: | |
|---|---|
| Observed In: | |
| Stage: | Adult |
Phenotype Detail
Acknowledgments
This image is the copyrighted work of the attributed author or publisher, and
ZFIN has permission only to display this image to its users.
Additional permissions should be obtained from the applicable author or publisher of the image.
Full text @ Sci. Rep.