
Fig. 6
- ID
- ZDB-FIG-190201-14
- Publication
- Naylor et al., 2018 - A novel mechanism of gland formation in zebrafish involving transdifferentiation of renal epithelial cells and live cell extrusion
- Other Figures
- All Figure Page
- Back to All Figure Page
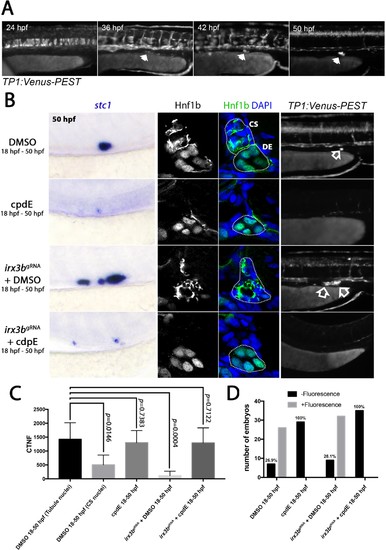
Notch inhibition precludes CS gland formation. (A) Panels show a stage series of fluorescent images of the TP1:VenusPEST transgenic line in the trunk region (arrows mark fluorescence in the region of the CS gland). (B) Left panels show lateral views of the posterior trunk showing stc1 expression after the indicated treatments. Middle panels show transverse sections of the pronephric tubule and position of the CS gland showing Hnf1b staining (±DAPI) after the same treatments. Right panels show lateral views of the trunk in the region of the CS gland (highlighted by unfilled arrow). (C) Histogram showing ‘corrected total nuclear fluorescence’ (CTNF) measurements of nuclei in the positions indicated. (D) Histograms showing the number of embryos with fluorescence in the CS gland in progeny from TP1:VenusPEST in-crosses with the indicated treatments. |
| Genes: | |
|---|---|
| Antibody: | |
| Fish: | |
| Condition: | |
| Knockdown Reagents: | |
| Anatomical Terms: | |
| Stage Range: | Prim-5 to Long-pec |
| Fish: | |
|---|---|
| Condition: | |
| Knockdown Reagents: | |
| Observed In: | |
| Stage: | Long-pec |