
Fig. 1
- ID
- ZDB-FIG-181003-14
- Publication
- Yakulov et al., 2018 - CXCL12 and MYC control energy metabolism to support adaptive responses after kidney injury
- Other Figures
- All Figure Page
- Back to All Figure Page
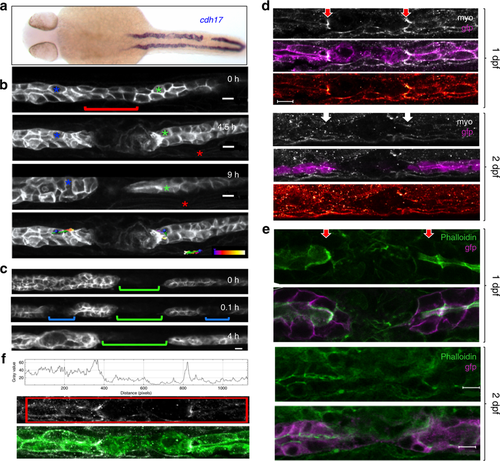
Pronephric ducts injured 1 day after fertilization fail to repair. a In situ hybridization for the pronephros-specific probe cadherin17 (cadh17) reveals that an injury applied 24 h after fertilization (24 hpf) is not repaired. The in situ hybridization was performed 24 h after injury. b Frames taken from a time-lapse movie of cldn2b:lyn-GFP transgenic embryo injured 30 hpf. Cells (blue and green asterisks) next to the gap exhibit little net movement. The gap persisted for 9 h after the injury. The red asterisk marks a somite border serving as a landmark. Tracking lines are color coded, ranging from blue to white (0–9 h) (scale bars, 10 µm). c Repair occurs in the absence of fluid flow. Frames were taken from a time-lapse movie injured first 1 day post fertilization (dpf) (green bracket), with two subsequent injuries (blue brackets) applied 2 dpf. Despite the lack of fluid flow both secondary injuries (blue brackets) recovered after 4 h. d Staining of cldn2b:lyn-GFP transgenic zebrafish embryos wounded at 1 or 2 dpf, fixed 30 min post wounding, and stained for phospho-myosin light chain-2 (MyoP). Activated myosin was detected at the edges of the pronephros injury in 1-day old embryos (red arrows), but not in 2-day-old embryos (white arrows). The bottom panel of each image shows the phospho-myosin levels using a color-coded range indicator (scale bars, 100 µm). e Staining of cldn2b:lyn-GFP transgenic zebrafish embryos wounded 1 or 2 dpf, fixed 4 h after wounding, and stained with phalloidin for actin. Actin staining was detected on the apical surface of cells close to the injury in both 1-day and 2-day old embryos. Actin staining was more prominent in 1-day embryos, and appeared perpendicular to the duct lumen (red arrows) (scale bars, 100 µm). f Quantification of the pixel intensity within the marked region of a single representative confocal plane from the MyoP staining (middle panel) of an embryo injured 1 dpf. The histogram depicts two peaks with increased levels of phosphorylated myosin adjacent to the injury. The bottom panel represents the merged image of GFP/MyoP staining |
| Genes: | |
|---|---|
| Fish: | |
| Condition: | |
| Anatomical Term: | |
| Stage Range: | Prim-5 to Long-pec |