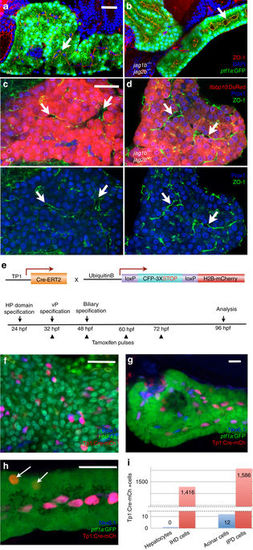
Intrahepatopancreatic ducts do not contribute significantly to the developing acinar and hepatocyte lineages. a–d Immunofluorescence analysis of the pancreas (a, b) and liver (c, d) in 5 dpf wild type (a, c) and jag1b −/− ;jag2b −/− mutant embryos (b, d, bottom panels with lfabp10:DsRed channel removed). Despite the absence of ductal cells in jag1b −/− ;jag2b −/− mutants b, d, lumen formation (arrows) and apical localization of ZO-1 (red in b, green in d) remain comparable to wild type siblings (a, c). Normal differentiation indicated by zymogen granule accumulation in the ptf1a:GFP+ pancreatic acinar cells (green) and lfabp-DsRed expression (red) in hepatocytes. e Schematic of approach to Notch activity lineage tracing. f–i Notch active labeled H2B-mCherry+ cells (red) in the liver are all Prox1+ (blue) and Hnf4a− (green) (n = 12 embryos, 1,416 labeled cells counted from two different experiments (f), P < 0.0001). g, h In the pancreas, nearly all H2B-mCherry+ cells (red) co-express Nkx6.1 (blue) and are ptf1a:GFP− (green) (n = 24 embryos, 1,586 labeled cells counted from 3 different experiments, P < 0.0001) g Only a few H2B-mCherry+ cells that lack Nkx6.1 but are ptf1a:GFP+ were observed (arrows, h. n = 4/24 embryos, 12 cells total). i Graph summarizing numbers of Notch active labeled H2B-mCherry+ cells found in hepatocytes versus intrahepatic duct (IHD) cells and acinar pancreas versus intrapancreatic duct (IPD) cells. Representative samples; a–d, n = 4 each. Scale bars 25 μM
|
