
Fig. 12
- ID
- ZDB-FIG-171228-29
- Publication
- England et al., 2017 - Identification and Expression Analysis of the Complete Family of Zebrafish pkd Genes.
- Other Figures
- All Figure Page
- Back to All Figure Page
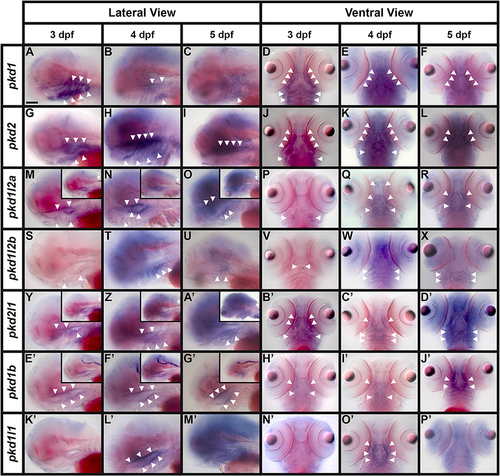
Expression of pkd genes in taste bud regions. Lateral (A–C,G–I,M–O,S–U,Y,Z,A',E'–G',K'–M') and ventral (D–F,J–L,P–R,V–X, B'–D',H'–J',N'–P') views of pkd gene expression at 3, 4, and 5 dpf. Rostral is left Rostral is left (A–C,G–I,M–O,S–U,Y,Z,A',E'–G',K'–M') and top (D–F,J–L,P–R,V–X,B'–D',H'–J',N'–P'). In most of the lateral views, the eyes are out of focus. Insets in (M–O) and (Y–A') show expression of pkd1l2a and pkd2l1 in KA cells in the rostral spinal cord (small white arrows). Insets in (E'–G') show expression of pkd1b in the floor plate of the midbrain and hindbrain. White arrowheads indicate the locations of pharyngeal expression. Scale bar (A) = 100 μm. |
| Genes: | |
|---|---|
| Fish: | |
| Anatomical Terms: | |
| Stage Range: | Protruding-mouth to Day 5 |