
Fig. 6
- ID
- ZDB-FIG-171228-23
- Publication
- England et al., 2017 - Identification and Expression Analysis of the Complete Family of Zebrafish pkd Genes.
- Other Figures
- All Figure Page
- Back to All Figure Page
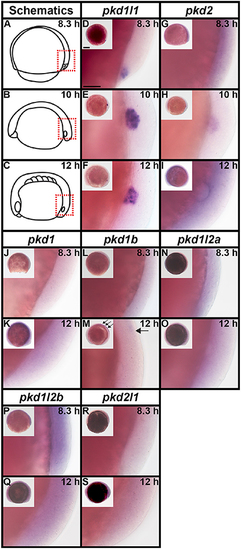
pkd2 and pkd1l1 are expressed in Kupffer's vesicle. Lateral expression of pkd genes at 8.3, 10, and 12 h. Region shown in main panel at each stage is indicated by red dotted boxes in schematics (A–C). Inset images in (D–S) show whole-mount view of embryo, dorsal forerunner cells/KV located in bottom right-hand corner. There is no expression of pkd1, pkd1b, pkd1l2a, pkd1l2b, or pkd2l1 in dorsal forerunner cells or KV at any of these stages. The boundary of the KV cavity is faintly visible in M as a slightly different focal plane has been shown to include spinal cord expression. However, pkd1b is not expressed in the margin of KV. Arrows in (M) indicate caudal limit of spinal cord expression of pkd1b. pkd1l1 is expressed in the KV region at all three stages (D–F) and pkd2 is expressed at 10 and 12 h but not 8.3 h (G–I). Scale bar (D) = 50 μm, (D–S) main panels and 200 μm, inset panels. |
| Genes: | |
|---|---|
| Fish: | |
| Anatomical Terms: | |
| Stage Range: | 75%-epiboly to 5-9 somites |