
Fig. 9
- ID
- ZDB-FIG-171228-26
- Publication
- England et al., 2017 - Identification and Expression Analysis of the Complete Family of Zebrafish pkd Genes.
- Other Figures
- All Figure Page
- Back to All Figure Page
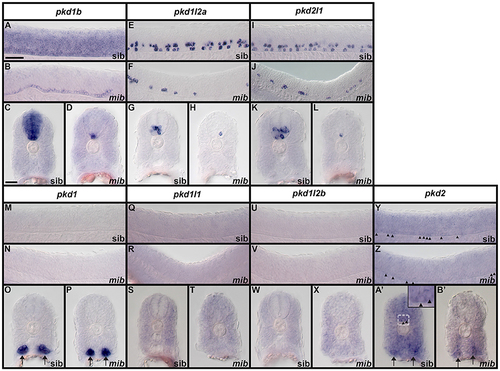
Expression of zebrafish pkd genes in mindbomb mutants. Lateral views (A,B,E,F,I,J,M,N,Q,R,U,V,Y,Z) and cross-sections (C,D,G,H,K,L,O,P,S,T,W,X,A',B') of pkd expression in the trunk of mindbomb mutants and sibling embryos with WT phenotypes. Dorsal is up. In lateral views, rostral is left and only the spinal cord region is shown. Arrows (O,P,A',B') indicate pronephros expression. Arrowheads (Y,Z,A' and higher magnification inset in A') indicate weak expression of pkd2 in the floor plate of the spinal cord. The focal plane in B' does not include labeled floor plate cells. Scale bar (A) = 50 μm (lateral views, A,B,E,F,I,J,M,N,Q,R,U,V,Y,Z); Scale Bar (C) = 30 μm (cross-sections, C,D,G,H,K,L,O,P,S,T,W,X,A',B') and 10 μm (inset in A'). |
| Genes: | |
|---|---|
| Fish: | |
| Anatomical Terms: | |
| Stage: | Prim-5 |