
Fig. 3
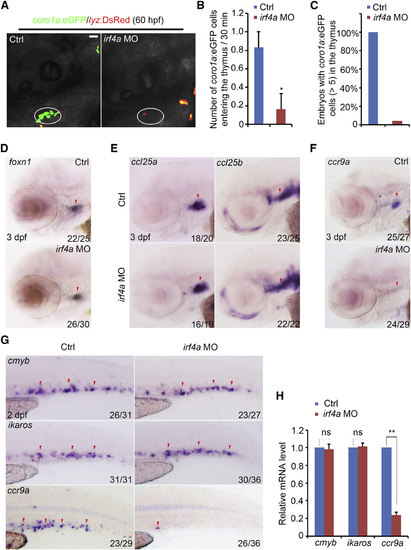
Homing Process Is Disturbed due to the Reduced Expression of ccr9a (A) Confocal imaging of coro1a:EGFP/lyz:DsRed embryos showing no coro1a:EGFP cells in the thymus (white circle) in irf4a morphants. Scale bar, 40 µm. (B) Number of coro1a:EGFP cells entering the thymus every 30 min in the control and irf4a morphants (n = 6) during the homing process. p < 0.05. (C) Quantification of embryos with coro1a:EGFP cells (>5) in the thymus of the control (n = 88) and irf4a morphants (n = 92) at 3.5 dpf. (D) Expression of foxn1 in the control and irf4a morphants at 3 dpf. (E) Expression of ccl25a and ccl25b in the control and irf4a morphants at 3 dpf. (F) Expression of ccr9a in the control and irf4a morphants at 3 dpf. Red arrows indicate the thymus or perithymic region. (G) Expression of cmyb, ikaros, and ccr9a in the CHT of the control and irf4a morphants at 2 dpf. Red arrows indicate hematopoietic progenitors expressing cmyb, ikaros, or ccr9a in the CHT region. (H) qPCR analysis of cmyb, ikaros, and ccr9a in the control and irf4a morphants at 2 dpf. ns, not significant. p < 0.01. All data are mean ± SD. See also Figure S3 and Movie S1. |
| Genes: | |
|---|---|
| Fish: | |
| Knockdown Reagent: | |
| Anatomical Terms: | |
| Stage Range: | Long-pec to Protruding-mouth |
| Fish: | |
|---|---|
| Knockdown Reagent: | |
| Observed In: | |
| Stage Range: | Long-pec to Protruding-mouth |
Reprinted from Developmental Cell, 34(6), Wang, S., He, Q., Ma, D., Xue, Y., Liu, F., Irf4 Regulates the Choice between T Lymphoid-Primed Progenitor and Myeloid Lineage Fates during Embryogenesis, 621-31, Copyright (2015) with permission from Elsevier. Full text @ Dev. Cell