|
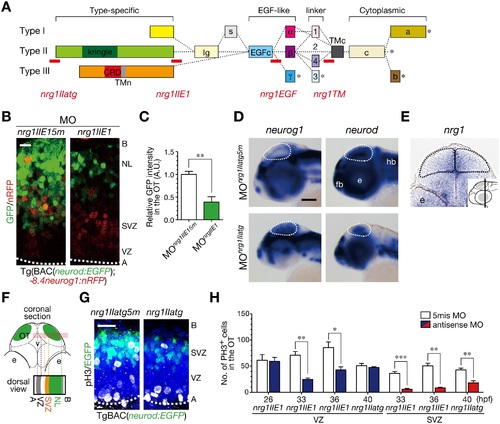
Generation of post-mitotic neurons requires NRG1-II. A. MOs against nrg1 used in this study. Domain structures of NRG1 type I–III isoforms are shown together with the target site (red bar) of each nrg1 MO. B. Decreased neurod:EGFP-positive neurons in MOnrg1IIE1-injected embryos (nrg1IIE1) compared to the control 5 nucleotides-mismatched MOnrg1IIE15m-injected embryos (nrg1IIE15m) of Tg(BAC(neurod:GFP);-8.4neurog1:nRFP) at 50 hpf. Scale bar, 10 µm. C. Quantification of neurod:EGFP intensity in the OT for the experiment shown in A (mean ± s.e.m.; **P < 0.01; n = 4 per group). D. WISH of MOnrg1IIatg-injected and the control MOnrg1IIatg5m-injected embryos for neurog1 and neurod mRNAs at 48 hpf. Scale bar, 100 µm. E. A coronal section of WISH-stained embryos for nrg1 mRNA at 36 hpf. The approximate site of the section is shown in a lateral view in the inset. F. A schematic of a stacked image of confocal sections from a dorsal view and the higher magnification of the OT from a dorsal view (bottom). G. Impaired neurogenesis and a decrease in pH3-positive mitotic cells in the SVZ of MOnrg1IIatg-injected TgBAC(neurod:EGFP) embryos (nrg1IIatg) compared to the control embryos (nrg1IIatg5m) at 40 hpf. Scale bar, 20 µm. H. Quantification of the number of pH3-positive cells in the VZ (blue) and the SVZ (red) of MOnrg1II-injected embryos and the control (white) embryos (mean ± s.e.m.; *P < 0.05, **P < 0.01, ***P < 0.001; n = 6, 6, 4, for nrg1IIE1, n = 6, 5, 5 for nrg1IIE15m at 26, 33, 36 hpf, n = 3, 4 for nrg1IIatg, nrg1IIatg5m at 40 hpf, respectively).
|