|
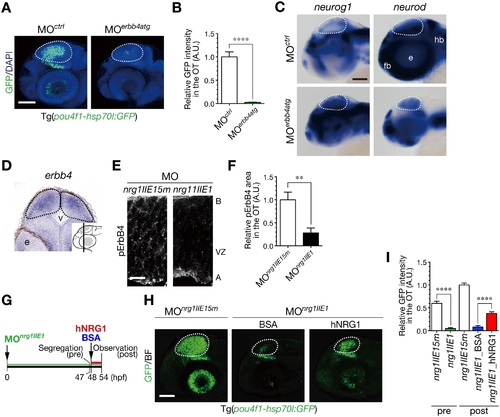
NRG1-II stimulates neurogenesis through ErbB4 as a cell-extrinsic signal. A. Impaired neurogenesis in MOerbb4atg-injected Tg(pou4f1-hsp70l:GFP) embryos at 50 hpf. Dotted circle, OT. Scale bar, 100 µm. B. Quantification of pou4f1-hsp70l:GFP intensity in the OT for the experiment shown in A (mean ± s.e.m.; ****P < 0.0001). C. WISH of MOerbb4atg-injected and the control MOctrl-injected embryos for neurog1 and neurod mRNAs at 48 hpf. Scale bar, 100 µm. D. A coronal section of WISH-stained embryos for erbb4 mRNA at 36 hpf. The approximate site of the section is shown in a lateral view in the inset. E. A decrease in Tyr1162-phosphorylated ErbB4 (pErbB4) in the OT of MOnrg1IIE1-injected embryos (nrg1IIE1) compared to the control MOnrg1IIE15m-injected embryos (nrg1IIE15m) at 40 hpf. Scale bar, 10 µm. F. Quantification of pErbB4-positive area in the OT for the experiment shown in E (mean ± s.e.m; **P < 0.01; n = 8, 9 for MOnrg1IIE1, MOnrg1IIE15m, respectively). G. A timeline of the injection of hNRG1 proteins into the hindbrain ventricle. MOnrg1IIE1-injected embryos with neurogenic phenotypes were segregated at 47 hpf, and they were subjected to intra-ventricle injection of hNRG1 or the control BSA. These embryos were analyzed at 54 hpf. H. Partial rescue of the defective neurogenesis in MOnrg1IIE1-injected Tg(pou4f1-hsp70l:GFP) embryos at 54 hpf following the injection of hNRG1 proteins, compared to the control BSA injection. Scale bar, 100 µm. I. Quantification of pou4f1-hsp70l:GFP intensity in the OT for the experiment shown in H (mean ± s.e.m.; ****P < 0.0001; n = 17 for MOnrg1IIE1_pre, n = 21 for MOnrg1IIE15m_pre, n = 11 for MOnrg1IIE1_BSA, n = 16 for MOnrg1IIE1_hNRG1, n = 18 for MOnrg1IIE15m_post.).
|