
FIGURE
Fig. 3
Fig. 3
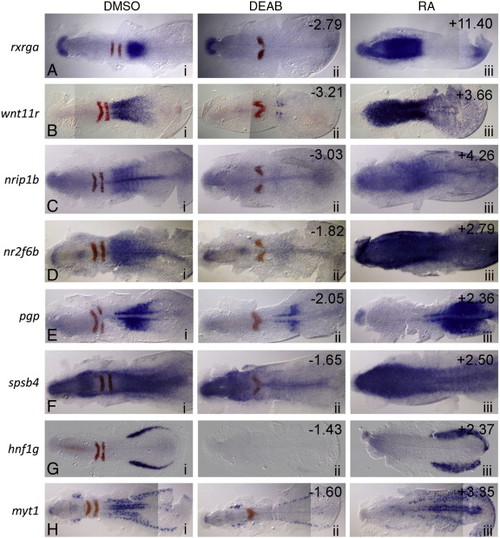
In situ validation of microarray hits whose expression is increased in RA-treated embryos and reduced in antagonist-treated embryos. Dorsal views of eight selected microarray hits (blue) and egr2b (red) in situ at 11 hpf. Anterior is to the left in all panels. Column i: control (DMSO) treated; ii: 10 µM DEAB (RA synthesis antagonist) treated; iii: 0.33 µM RA-treated. The numbers in the upper right corners refer to the fold-change in expression level identified on the microarray under the corresponding conditions. |
Expression Data
| Genes: | |
|---|---|
| Fish: | |
| Conditions: | |
| Anatomical Terms: | |
| Stage: | 1-4 somites |
Expression Detail
Antibody Labeling
Phenotype Data
Phenotype Detail
Acknowledgments
This image is the copyrighted work of the attributed author or publisher, and
ZFIN has permission only to display this image to its users.
Additional permissions should be obtained from the applicable author or publisher of the image.
Reprinted from Developmental Biology, 338(1), Feng, L., Hernandez, R.E., Waxman, J.S., Yelon, D., and Moens, C.B., Dhrs3a regulates retinoic acid biosynthesis through a feedback inhibition mechanism, 1-14, Copyright (2010) with permission from Elsevier. Full text @ Dev. Biol.