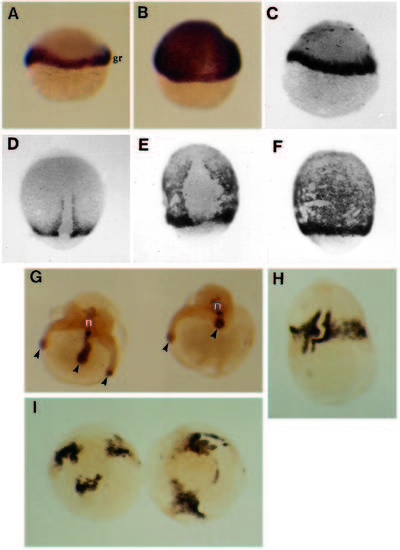
Effect of eFGF on the expression patterns of ntl, sna1 and myosin. (A) Lateral view of normal embryo at the germ ring stage showing ntl expression restricted to the germ ring (gr). (B) Similar embryo injected with eFGF, showing ubiquitous ntl expression. (C) eFGF-injected embryo at the onset of gastrulation, showing normal distribution of sna1 transcripts in the germ ring (black dots over the animal pole are processing artefacts). (D,E,F) sna1 expression at 80-90% epiboly. (D) Normal embryo at 80% epiboly showing expression restricted to the hypoblast of the germ ring and adaxial cell on either side of the notochord progenitors. (E) Dorsal and (F) ventral view of an eFGF-injected embryo at 9 hpf. sna1 is now expressed throughout the hypoblast, except on the dorsal side (as normal). (G) Injected embryos at 18 hpf. Ntl protein was detected in the notochord (n) and in mesenchymal cells at the ends of the axial extensions (arrowheads). Embryos only ever contained one notochord. (H,I) Myosin staining in injected embryos at 18 hpf. The embryo in H shows myosin staining throughout the belt of tissue, with segmental staining running either side of the notochord (n). (I) Polar view of injected embryos with several separate regions of myosin staining, corresponding in number and position to the axial-extensions.
|
