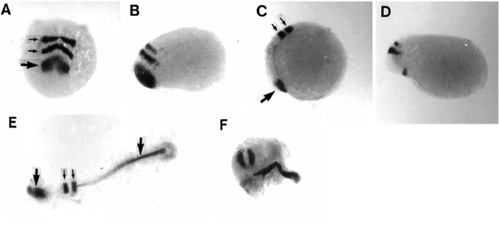
Expression patterns of anterior markers after eFGF overexpression. (A) A normal 3-somite embryo viewed from the anterior end showing pax2 RNA at the midbrain-hindbrain border (large arrow) and krx-20 RNA in hindbrain rhombomeres 3 and 5 (small arrows). (B) Lateral view, anterior to the left, of eFGFinjected embryo showing pax2 and krx-20 close to the presumptive anterior limit of the embryo. (pax2 expression was absent in one-third of injected embryos at the 10-somite stage.) (C) Normal expression pattern of isl1 in the pillow (large arrow) and krx-20 in the hindbrain (small arrows) in a 3-somite embryo (lateral view, anterior to the left). (D) Injected embryo at a similar stage (orientated as in C), showing the marked decrease in the distance between these two markers. (E) Dorsal view of flat-mounted 3 somite embryo, anterior to the left, showing the normal expression domains of rtk1. From left to right these are the forebrain (large arrow), rhombomeres 3 and 5 (small arrows), and notochord (large arrow). (F) Dorsal view of injected embryo, anterior to left, showing strong expression in the hindbrain rhombomeres and the notochord, which is broader than normal, but with no discernible forebrain expression.
|
