
FIGURE
Fig. 7
- ID
- ZDB-FIG-140226-50
- Publication
- Griffin et al., 1995 - Analysis of FGF function in normal and no tail zebrafish embryos reveals separate mechanisms for formation of the trunk and the tail
- Other Figures
- All Figure Page
- Back to All Figure Page
Fig. 7
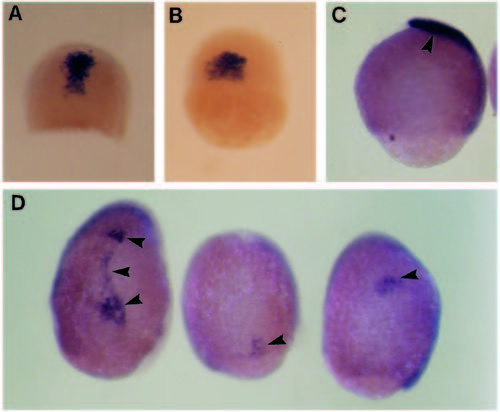
Effect of eFGF over-expression on gsc expression. (A) Normal embryo at shield stage; gsc is expressed in a single group of cells on the dorsal side. (B) Injected embryo, showing normal gsc expression for this stage. (C) Lateral view of normal embryo at 9 hpf; gsc-expressing cells have migrated to the animal pole (arrowhead) and still strongly express this gene. (D) Dorsal view, animal pole at the top, of injected embryos. gsc expression is very weak, and the expressing cells are in abnormal locations (arrowheads). |
Expression Data
| Gene: | |
|---|---|
| Fish: | |
| Anatomical Terms: | |
| Stage Range: | Shield to 90%-epiboly |
Expression Detail
Antibody Labeling
Phenotype Data
Phenotype Detail
Acknowledgments
This image is the copyrighted work of the attributed author or publisher, and
ZFIN has permission only to display this image to its users.
Additional permissions should be obtained from the applicable author or publisher of the image.
Full text @ Development