
Fig. 1
- ID
- ZDB-FIG-140122-21
- Publication
- Venkiteswaran et al., 2013 - Generation and Dynamics of an Endogenous, Self-Generated Signaling Gradient across a Migrating Tissue
- Other Figures
- All Figure Page
- Back to All Figure Page
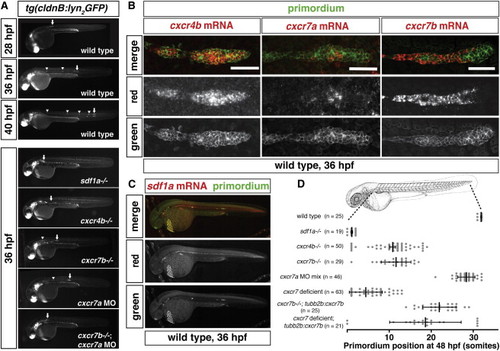
Expression and Requirement of Sdf1a and Its Receptors Cxcr4b, Cxcr7a, and Cxcr7b during Primordium Migration (A) Live images of embryos of the indicated stage and genotype. Arrow indicates the primordium, and arrowheads indicate neuromasts. (B) Fluorescent staining for cxcr4b, cxcr7a, or cxcr7b mRNA and GFP protein at 36 hpf. Scale bar, 50 μm. (C) Fluorescent staining for sdf1a mRNA and GFP protein in a tg(cldnB:lyn2GFP) embryo at 36 hpf. Anterior is to the left, and posterior is to the right. (D) Quantification of primordium migration in 48 hpf embryos of indicated genotypes. The vertical bars represent the average position of the primordium, the error bars represent SD, and the circles represent the positions of individual primordia. 48 hpf embryo schematic adapted from (Kimmel et al., 1995). See also Figure S6. |
| Genes: | |
|---|---|
| Fish: | |
| Knockdown Reagents: | |
| Anatomical Terms: | |
| Stage Range: | Prim-5 to Prim-25 |
| Fish: | |
|---|---|
| Knockdown Reagents: | |
| Observed In: | |
| Stage: | Long-pec |
Reprinted from Cell, 155(3), Venkiteswaran, G., Lewellis, S.W., Wang, J., Reynolds, E., Nicholson, C., and Knaut, H., Generation and Dynamics of an Endogenous, Self-Generated Signaling Gradient across a Migrating Tissue, 674-687, Copyright (2013) with permission from Elsevier. Full text @ Cell