
Fig. 6
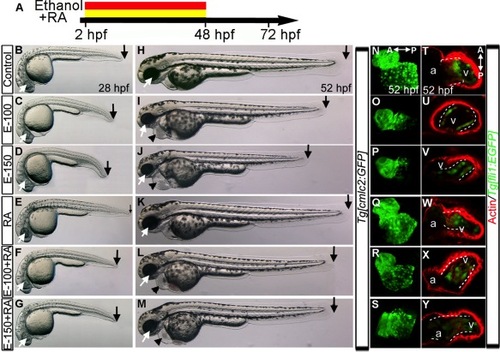
RA Supplementation during chronic ethanol treatment (2–48hpf) does not restore normal heart development. A: Schematic diagram showing the timing of ethanol and RA exposure. B–M: Live images of embryos at 28 (B–G) and 52 hpf (H–M) showed normal morphology in the control (B, H) and RA-treated (E, K) embryos. Ethanol-treated embryos exhibited small eye, shorter body (C, D, I, J) and pericardial edema (I, J). Ethanol+RA-treated embryos showed near normal eye size, slightly shorter body (F, G, L, M) and pericardial edema (L, M). Arrows, black, posterior end of the embryos; white arrow, eye, black arrowhead, pericardial edema. N–S: 3D renderings of fixed Tg[cmlc2:GFP] embryo confocal sections showed normal cardiac morphology in control (N) and RA-treated embryos (Q); straight hearts in ethanol-treated embryos (O, P); near normal or straight heart in ethanol+RA-cotreated (R, S) embryos. T–Y: Phalloidin-stained Tg[fli1:EGFP] embryos: clustering of GFP/F-actin-positive cells (white dashed line) at the AV boundary in the control (T) and RA-treated embryos (W); reduction and dispersion of GFP/ F-actin positive cells in ethanol-treated embryos (U, V); dispersion of GFP/F-actin-positive cells throughout the ventricle in ethanol+RA cotreated embryos (X, Y). A, anterior; P, posterior. |