
Fig. 3
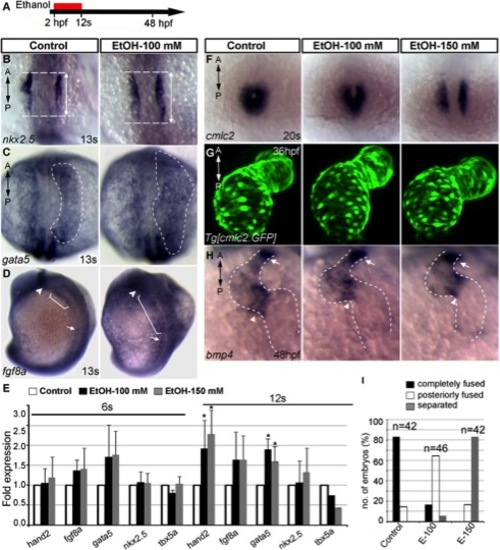
Ethanol exposure during gastrulation through cardiac specification induces defects in cardiac gene expression and myocardial migration. A: Schematic diagram shows the timing of ethanol exposure. B–D: Whole mount ISH at 13s stages showed moderate expansion of expression domains for nkx2.5 (B) (see Fig. 7C for statistical significance), gata5 (C), and fgf8a (D) in the ethanol-treated embryos, as compared to control. E: Transcript levels of genes expressed in differentiating myocardial cells increased after ethanol treatment. Quantitative RT-PCR assays comparing cardiogenic gene expression levels at 6s and 12s stages (average fold change from at least 3 independent experiments), Student′s t-test: *P<0.01. F: ISH detecting cmlc2 at 20s stage showed cardiac fusion delay after ethanol treatment (2 hpf-12s). G: Live images of Tg[cmlc2:GFP] embryos exposed to ethanol (2 hpf-12s) showed normal cardiac looping and normal chamber morphology. H: bmp4 expression examined by ISH. Ethanol-exposed (2 hpf-12s) embryos showed normal bmp4 expression pattern. Arrowheads, AV boundary; arrows, OFT; dotted line, cardiac silhouette. I: Graph illustrates myocardial fusion differences at 20s stage in control and ethanol-treated embryos. Mantel-Haenszel chi-square tests: P<0.0001 for both control versus EtOH-100 and control versus EtOH-150. n, number of embryos; A, anterior; P, posterior. |