
Fig. 4
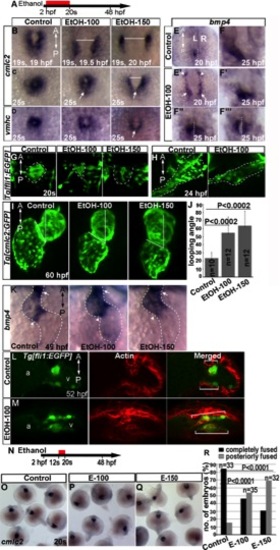
Ethanol exposure until cardiac fusion produces defects that persist at later stages of development. A, N: Schematic diagrams showing the timing of ethanol exposure. B–D: ISH of cmlc2 expression at 19s and 25s; vmhc expression at 25s showed delay in myocardial fusion in ethanol-exposed embryos. Arrows, posterior fusion. E, E2: bmp4 expression at 20 hpf. E: Control. E2: Ethanol-exposed embryos. Arrow, cardiac primordium; arrowhead: posterior retina. F–F32: bmp4 expression at 25 hpf. F: Control. F2–F23: representatives of ethanol-exposed embryos. White dotted line represents midline of the body. G, H: Tg[fli1:EGFP] embryo images at 20s (G) and 24 hpf (H) stages showed defective endocardium formation after ethanol exposure. I: Tg[cmlc2:GFP] embryo images showed aberrant looping angle. J: Graph shows quantification of looping angle. K: bmp4 expression in the control and ethanol-exposed embryos at 48 hpf. Arrowhead, AV boundary; arrow, OFT. L, M: Stained Tg[fli1:EGFP] embryos showed dispersion of GFP and F-actin-positive cells (white brackets) throughout the ventricle after ethanol exposure. N–R: Ethanol exposure only during myocardial migration (12s–20s) causes modest fusion delay. O–Q: ISH showed cmlc2 expression. O: Control. P,Q: ethanol-exposed embryos. R: Graph shows quantification of myocardial precursors fusion. P value: Mantel-Haenszel chi-square tests. A, anterior; P, posterior. |