
Fig. 5
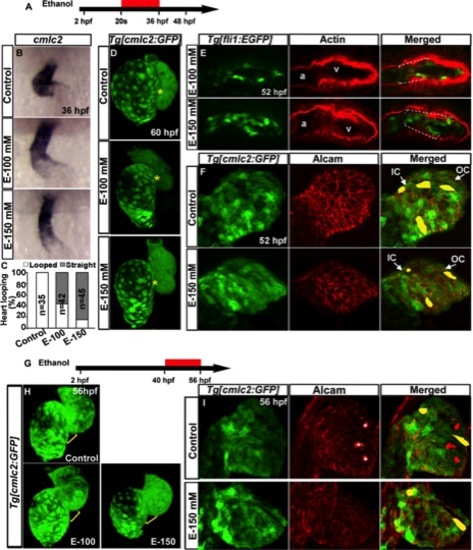
Ethanol exposure during cardiac looping caused abnormal heart morphogenesis and defective endocardial cushions. A, G: Schematic diagram showing ethanol exposure timing. B: ISH detecting cmlc2 at 36 hpf: control, normal looping; EtOH-100 mM, modest looping; EtOH-150 mM, straight heart tube. C: Graph quantifies looped and straight heart at 36 hpf. D: 3D confocal images of Tg[cmlc2:GFP] embryos: control, normal heart chambers; ethanol-treated embryos, aberrant heart chambers. Yellow asterisks, AV canal. E: Ethanol-treated Tg[fli1:EGFP] embryos showed dispersed GFP and F-actin-positive cells (white dashed line) throughout the ventricle (compare control panel 2E). F: Alcam-stained Tg[cmlc2:GFP] embryo showed similar distribution of cardiomyocytes in the control and ethanol-treated embryos. G–I: Ethanol exposure during cardiac chamber growth did not lead to defective chamber wall formation. H: 3D confocal images of Tg[cmlc2:GFP] embryos. Control and E-100 mM, normal heart; E-150, nearly normal heart chamber. Yellow brackets, AV region. I: Alcam-stained Tg[cmlc2:GFP] embryos showed similar pattern of cardiomyocyte distribution in the ventricular wall in ethanol-treated and control embryos. White asterisk, alcam-positive hatching gland cells, which are outside the heart but seen in this 3D rendering. Representative cell shapes are highlighted in yellow. Anterior to the top. |