
Fig. 1
- ID
- ZDB-FIG-131010-5
- Publication
- D'Aniello et al., 2013 - Depletion of Retinoic Acid Receptors Initiates a Novel Positive Feedback Mechanism that Promotes Teratogenic Increases in Retinoic Acid
- Other Figures
- All Figure Page
- Back to All Figure Page
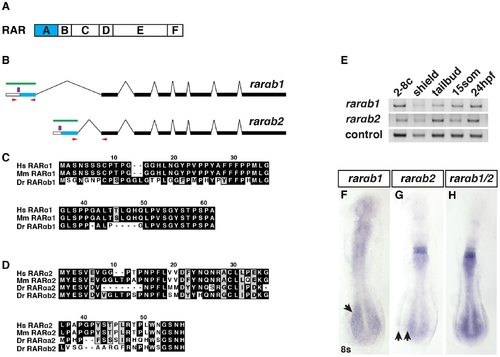
RARαb1 and RARαb2 sequences and expression. (A) Schematic representation of RAR domains. Blue box indicates the variable A domain, which is different between RARαb1 and the previously identified RARαb2 splice variant. (B) Schematic representation of RARαb1 and RARαb2 genomic organization (adapted from Ensemble_v9). Blue bars represent the first exon, which encodes the respective A domains. White bars represent the 52 UTRs. Black bars represent the exons that are common to the two variants. Green bars represent the target of the antisense probes used for ISH. Red arrows indicate the position of the primers used to perform RT-PCR. Purple bars indicate the position of the morpholino target sequences. (C) Alignments of the A domains of human (Hs) RARα1, mouse (Mm) RARα1, and zebrafish (Dr) RARαb1. The presence of this previously unrecognized splice variant was recently confirmed in the latest zebrafish genome assembly (Ensemble Zv9). There is no RARαa splice variant 1 ortholog in the zebrafish genome. (D) Alignments of the A domains of Hs RARα2, Mm RARα2, Dr RARαa2, and Dr RARαb2. (E) Reverse transcriptase PCR (RT-PCR) for the zebrafish rarαb isoforms. max was used as the control. -RT control did not reveal genomic contamination (data not shown). (F) Rarαb1 is expressed in the ventral anterior of the embryo and the presomitic paraxial mesoderm (arrow) at the 8 somite (s) stage. (G) Rarαb2 is expressed in rhombomeres 5 and 6, the spinal cord and the posterior lateral plate mesoderm (LPM). Arrows indicate the space between the posterior spinal cord and LPM expression domains. (H) Together, the expression patterns recapitulate a previously reported rarαb probe (referred to as rarαb1/2), which detects both isoforms [24]. In F–H, embryos are flatmounted and are dorsal views with anterior up. |
| Gene: | |
|---|---|
| Fish: | |
| Anatomical Terms: | |
| Stage Range: | 2-cell to Prim-5 |