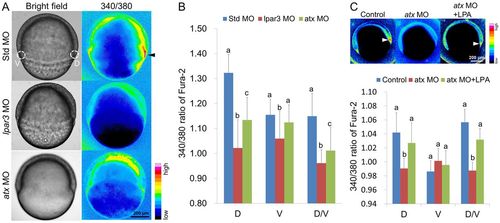
Calcium rise in the DFCs is abolished in lpar3 and atx morphants. (A) Zebrafish embryos were injected with the indicated MOs and fura-2 dextran, incubated to the shield stage and photographed under bright and dark field. The dark-field images were converted to 16-color intensity images (intensity bar is shown in the bottom right corner of A) using Image J software. The shield showed higher calcium levels in control embryos (with peak levels in DFCs; black arrowhead) than those in lpar3 and atx morphants. (B) The peak 340/380 nm ratio in the shield/DFCs region (cycles at the dorsal side) and the ventral blastoderm region (cycles at the ventral side) were measured using Image J software (n=10 for each treatment from three independent experiments). The dorsal, ventral and dorsal/ventral 340/380 nm ratios are shown. (C) Similar analysis was applied in atx morphants with additional DFC-targeting LPA delivery. LPA restores the calcium signal in the shield/DFC region. a, b, c, groups denoted with different lettering refer to statistical significance (P<0.05).
|
