
Fig. 3
- ID
- ZDB-FIG-110914-1
- Publication
- Hensley et al., 2011 - Cellular Expression of Smarca4 (Brg1)-regulated Genes in Zebrafish Retinas
- Other Figures
- All Figure Page
- Back to All Figure Page
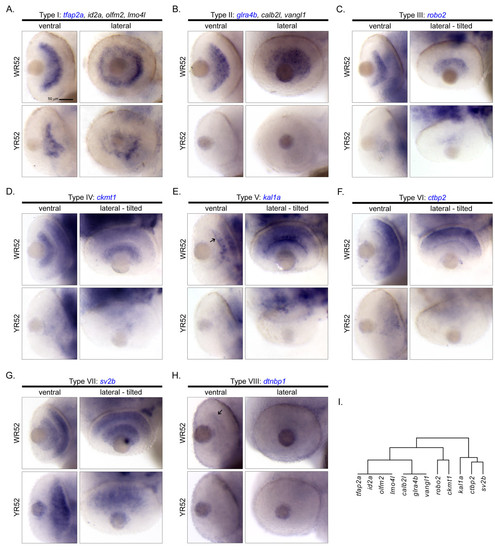
Cellular expression patterns of Smarca4-regulated retinal genes specifically expressed in GCL and/or INL at 52 hpf only. A total of 14 genes were clustered in a clade with a relatively significant p-value (< 0.1; Figure 2). Except for rlbp1l and irx7 that expressed at both 36 and 52 hpf and are shown in Figure 5, all remaining 12 genes only expressed at 52 hpf in GCL and/or INL. There are eight types of cellular expression pattern: (A) tfap2a, id2a, olfm2 & lmo4l, (B) glra4b, calb2l & vangl1, (C) robo2, (D) ckmt1, (E) kal1a, (F) ctbp2, (G) sv2b and (H) dtnbp1. If more than one gene has the same expression pattern, only one example is shown and its name is highlighted in blue. For each gene, the ventral and the lateral views of WT and smarca4a50/a50 retinas are shown. In some cases, the embryo was slightly tilted from the lateral view to facilitate a better observation of the expression domain. Some specific expression locations in the retina are highlighted by black arrows. The corresponding clade of the dendrogram from Figure 2D is reproduced in (I). Refer to Figure 1 for sample abbreviations. Scale bar: 50 μm. |
| Genes: | |
|---|---|
| Fish: | |
| Anatomical Terms: | |
| Stage: | Long-pec |