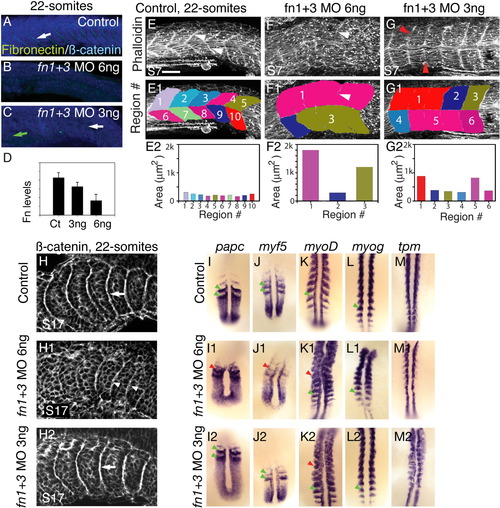
A reduction in fibronectin (Fn) levels disrupts formation of anterior somites. A-D: Side views, anterior left, dorsal top, of 22-somite embryos stained for Fn (green) and β-catenin (blue) to visualize all cells. Somite 10, or the approximate region of somite 10, is to the left. A: In control embryos, Fn is concentrated at segment boundaries (white arrow). B: Injection of 6-ng fn1+3 morpholinos (MOs) results in a strong reduction Fn protein. C: In embryos injected with 3-ng fn1+3 MOs, Fn is reduced anteriorly (green arrow). Posteriorly, Fn concentration at boundaries is stronger, but not as strong as control posterior boundaries (white arrow). D: Quantification of levels of Fn in 3-ng and 6-ng morphants (y axis is arbitrary units). Fn protein is reduced in 3-ng fn1+3 morphants and strongly reduced in 6-ng fn1+3 morphants. E-G: Side views, anterior left, dorsal top, of 22-somite embryos stained with phalloidin to outline cells. E: Somite 7, or the approximate region of somite 7 is to the left. In control embryos, segment boundaries are clearly visible (white arrowheads). Segment boundaries were interactively traced (E1, see the Experimental Procudures section). The myotomes in control embryos are approximately the same size (E2). F: In 6-ng fn1+3 MO-injected embryos, anterior myotome boundary formation is severely disrupted (F, F1, white arrowheads indicate a tiny myotome boundary in the original data and the same image with myotome regions overlaid) and myotomes areas are large and irregular. G: Anterior myotomes are less disrupted in 3-ng fn1+3 MO-injected embryos (red arrowheads indicate where boundaries should be). H: Side views, anterior left, dorsal top, of 22-somite embryos stained with β-catenin, somite 17 or the approximate region thereof is on the left. In control embryos somite boundaries are seen as bright white lines (H, white arrow). In embryos injected with 6 ng of fn1+3 MOs imperfect posterior somite boundaries form (H1, white arrowheads). Robust somite boundaries form in the posterior of 3-ng fn1+3 morphant embryos (H2, white arrow). I-M: Dorsal views, anterior top, of 18-somite embryos. Analysis of mRNA expression correlates with the morphological analysis in that injection of 3-ng fn1+3 MOs disrupts anterior, but not posterior, patterning. Note that gene expression patterns in the posterior presomitic mesoderm such as papc and myf5 is segmental in both control and 3-ng fn1+3 MO-injected embryos (I, I2, J, J2, green arrowheads) but the segmental pattern is slightly disrupted in 6-ng fn1+3 MO-injected embryos (I1,J1, red arrowheads). myoD is expressed in stripes in control (K, green arrowhead) embryos throughout the A-P axis. Striped expression of myoD is disrupted in the anterior of 3 and 6-ng fn1+3 MO-injected embryos (K1, K2, red arrowheads) but is segmental posteriorly (K1, K2, green arrowheads). The expression patterns of myogenin (myog) and tropomyosin (tpm) are similar, but levels of myog and tpm in the posterior of 6-ng fn1+3 morphants are qualitatively reduced. Scale bar = 50 μm.
|
