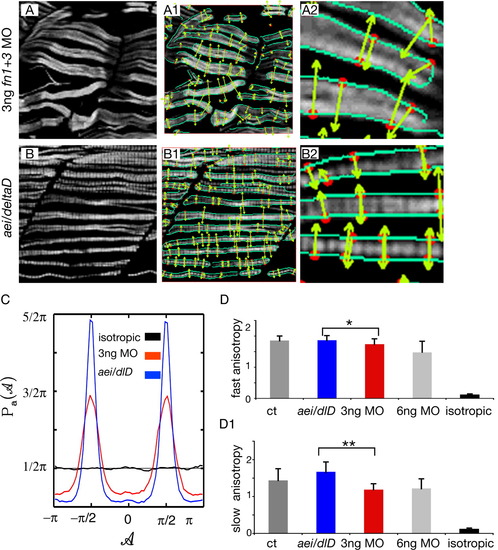
Muscle fibers in 3-ng fn1+3 morphant embryos are more randomly structured than fibers in aei/deltaD mutant embryos. A,B: F59 denotes slow-twitch fibers, side views, anterior left, dorsal top. Note that fibers in 3-ng fn1+3 morphant embryos appear slightly more disorganized than those in aei/deltaD mutant embryos. The maxima chains (A1, A2, B1, B2, green edge detection lines) are defined by the positions where the Wavelet-Transform Modulus is locally Maximum (i.e., the WTMM) in the direction A of the gradient vector. The WTMM maxima (WTMMM; A1, A2, B1, B2, red dots) indicate locally the direction where the signal has the sharpest variation (A1, A2, B1, B2, green arrows). C: The WTMMM vector angle probability density functions (pdfs) are displayed for the aei/deltaD mutants (blue curve), the fn1+3 morphants (red curve), as well as for the isotropic fBm surfaces analyzed for calibration purposes (black curve fluctuating around π/2). Also shown is the flat 1/2π curve that would be obtained for a purely theoretical isotropic process (flat pointed line at 1/2π). Note the stronger peaks in aei/deltaD mutant embryos. D-D1: The anisotropy factor, an indication of organized structure, of fast-twitch fibers in fn morphant embryos is not only significantly lower than in control embryos, but is also significantly lower than in aei/deltaD mutant embryos. In contrast, the anisotropy factor of fast-twitch fibers in aei/deltaD mutant embryos is not significantly different from control embryos. These results indicate that fast-twitch fibers in fn morphant embryos not only appear more disorganized, but are quantitatively more disorganized than in aei/deltaD mutant embryos. The anisotropy of slow-twitch fibers in fn morphant embryos is also significantly lower than in control embryos and aei/deltaD mutant embryos. *P < 0.05, **P < 0.001. For comparison, the anisotropy factor obtained from the analysis of the isotropic fBm images (0.12 ± 0.02) is also shown.
|
