
FIGURE
Fig. 4
- ID
- ZDB-FIG-060307-17
- Publication
- Okuda et al., 2006 - Comparative genomic and expression analysis of group B1 sox genes in zebrafish indicates their diversification during vertebrate evolution
- Other Figures
- All Figure Page
- Back to All Figure Page
Fig. 4
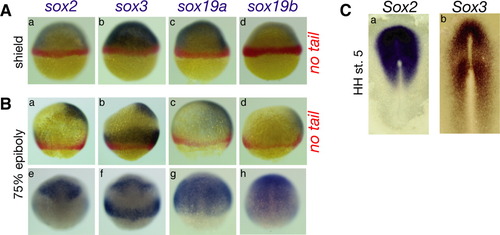
The expression of zebrafish group B1 sox genes from the shield to the epiboly stages of embryonic development, visualized by whole-mount in situ hybridization. A: Lateral views of shield stage embryos with the dorsal side toward the right. B: Lateral views of 75% epiboly stage embryos with the dorsal side toward the right (a-d) and dorsal views with animal toward the top (e-h). Double labeling shows sox expression in blue, and no tail expression in red (A,B). C: Chicken Sox2 expression at early HH stage 5 (a) and Sox3 expression at late HH stage 5 (b). |
Expression Data
| Genes: | |
|---|---|
| Fish: | |
| Anatomical Terms: | |
| Stage Range: | Shield to 75%-epiboly |
Expression Detail
Antibody Labeling
Phenotype Data
Phenotype Detail
Acknowledgments
This image is the copyrighted work of the attributed author or publisher, and
ZFIN has permission only to display this image to its users.
Additional permissions should be obtained from the applicable author or publisher of the image.
Full text @ Dev. Dyn.