
- Title
-
Partial Hepatectomy Promotes the Development of KRASG12V-Induced Hepatocellular Carcinoma in Zebrafish
- Authors
- Zhu, M., Li, Y., Liu, D., Gong, Z.
- Source
- Full text @ Cancers
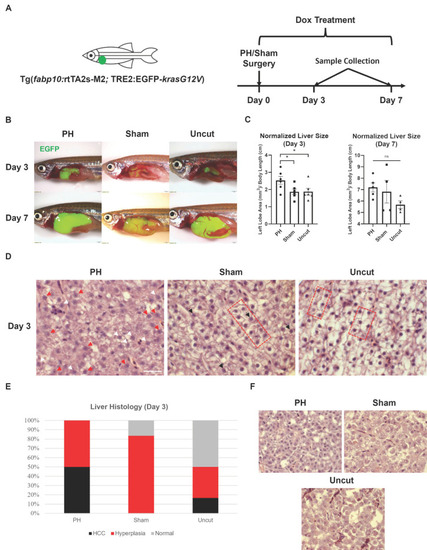
Effects of PH on the |
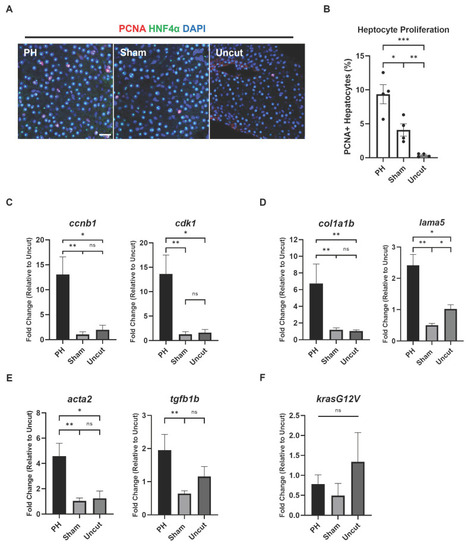
Effects of PH on the progress of HCC-associated characteristics in |
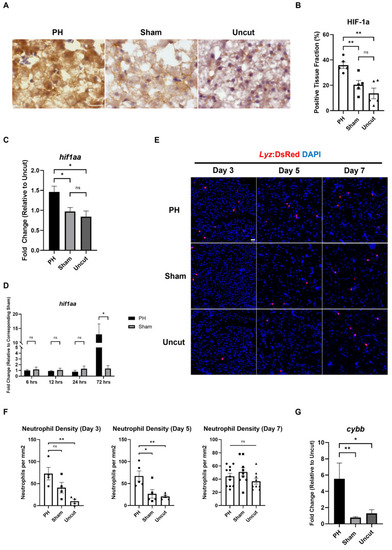
Effects of PH on oxidative stress and neutrophil activity in the |
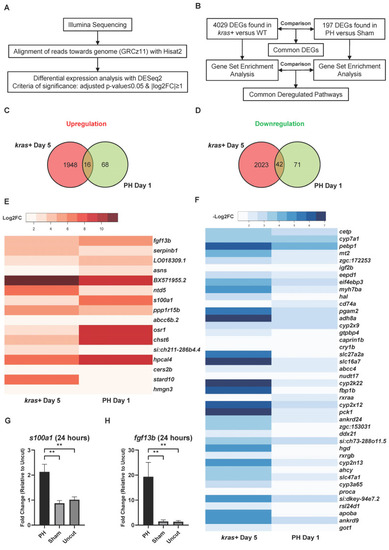
Comparison of DEGs during |
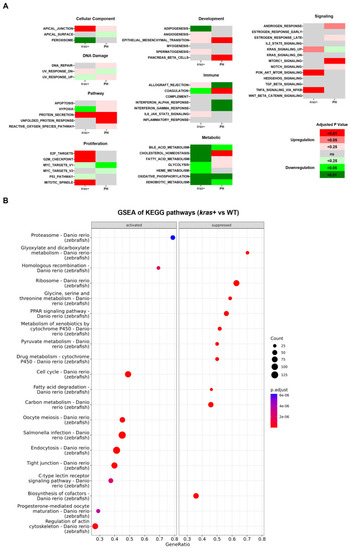
Comparison of changes in biological functions and pathways between the |
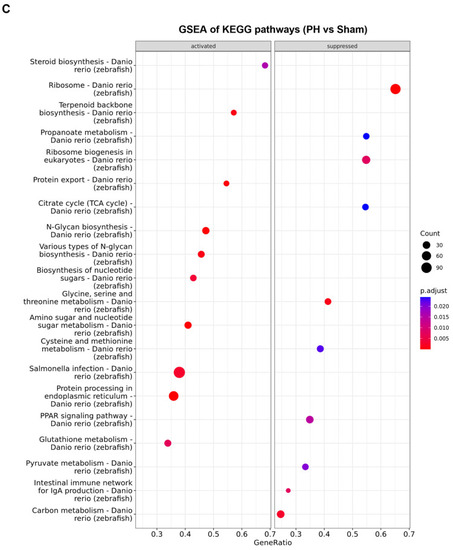
Comparison of changes in biological functions and pathways between the |
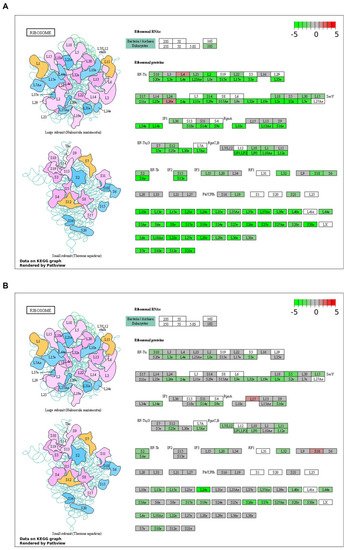
Regulation of ribosome protein genes and ribosomal RNAs during |
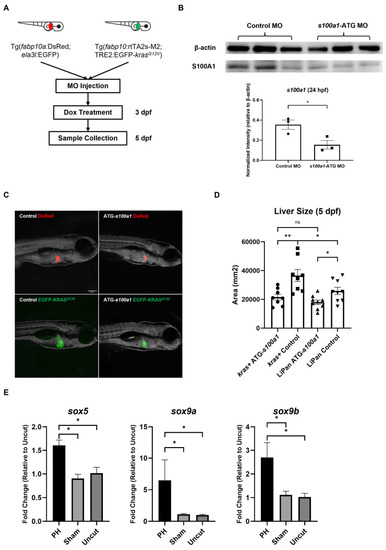
The effect of |