IMAGE

Figure 1

ID
ZDB-IMAGE-240527-85
Source
Figures for Zhu et al., 2024
Image
Figure Caption

Figure 1

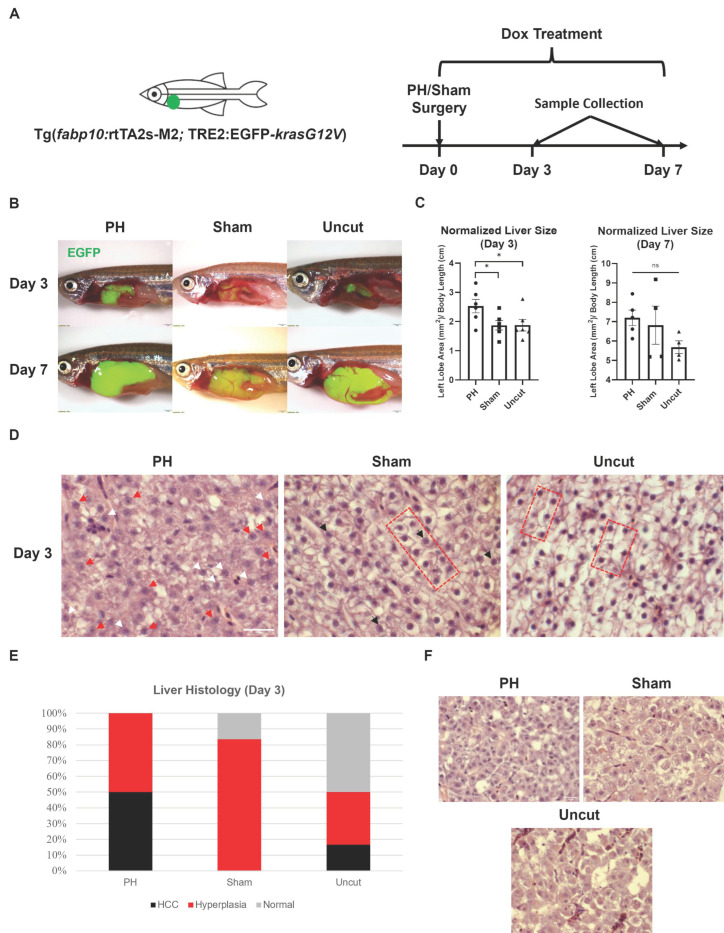
Effects of PH on the krasG12V-induced development of HCC in zebrafish. (A) Schedule of surgeries and Dox treatment in the experiment. Right after PH or sham surgery, kras+ male zebrafish were exposed to 20 mg/L Dox to induce the overexpression of oncogene krasG12V in the liver. (B) Representative photos of PH/sham surgery-treated kras+ zebrafish 3 days and 7 days after Dox induction. (C) Measurement and comparison of the 2D area of the kras+ livers in mm2 based on (B) after being normalized with the body length in cm (n ≥ 4). Circles, squares, and triangles indicate values of individual samples. (D) Representative H&E staining images of the PH/sham surgery-treated kras+ zebrafish livers 3 days after Dox induction (n = 6). Examples of morphology associated with HCC and hyperplasia are indicated with symbols. Red arrowheads: irregular nuclei with prominent nucleoli; white arrowheads: nuclei with multiple nucleoli; black arrowheads: enlarged nuclei with prominent nucleoli; red bracket: two-cell hepatocyte plate structures. (E) Quantification of HCC histology observed in kras+ zebrafish from each treatment group on Day 3 based on (D). (F) Representative H&E staining images of the PH/sham surgery-treated kras+ zebrafish livers 7 days after Dox induction (n = 6). Scale Bar = (B) 1 mm and (D,F) 20 μm. ns p > 0.05, * p ≤ 0.05.

Acknowledgments
This image is the copyrighted work of the attributed author or publisher, and ZFIN has permission only to display this image to its users. Additional permissions should be obtained from the applicable author or publisher of the image. Full text @ Cancers