FIGURE

Figure 5

ID
ZDB-FIG-240527-90
Publication
Zhu et al., 2024 - Partial Hepatectomy Promotes the Development of KRASG12V-Induced Hepatocellular Carcinoma in Zebrafish
Other Figures
All Figure Page
Back to All Figure Page
Figure 5

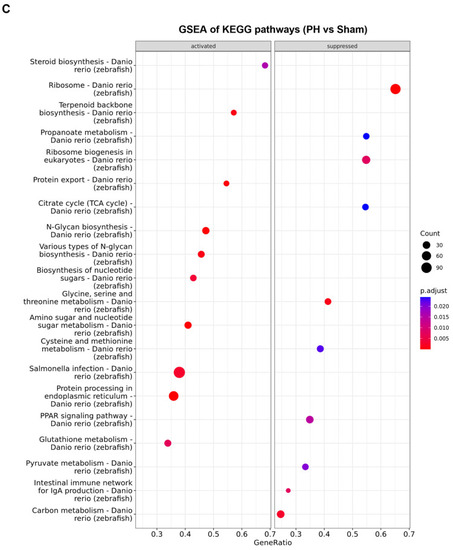
Comparison of changes in biological functions and pathways between the kras+ zebrafish liver and the PH liver. (A) Comparison between the changes in the activity of Hallmark gene sets in the kras+ liver on Day 5 following Dox induction and those in the PH livers on Day 1 following PH based on the GESA of Hallmark gene sets. The color key indicates the direction of changes (red: upregulation; green: downregulation) and significance (adjusted p-value). (B,C) GESA of KEGG pathway in (B) kras+ livers on Day 5 following Dox induction and (C) PH livers on Day 1 following PH. The size of the dots indicates the number of leading-edge genes in the corresponding gene set. The color key indicates significance in adjusted p-value. Gene Ratio is the ratio of leading-edge genes versus all genes in the gene set.

Expression Data

Expression Detail
Antibody Labeling
Phenotype Data

Phenotype Detail
Acknowledgments
This image is the copyrighted work of the attributed author or publisher, and ZFIN has permission only to display this image to its users. Additional permissions should be obtained from the applicable author or publisher of the image. Full text @ Cancers