IMAGE

Figure 3

ID
ZDB-IMAGE-240527-87
Source
Figures for Zhu et al., 2024
Image
Figure Caption

Figure 3

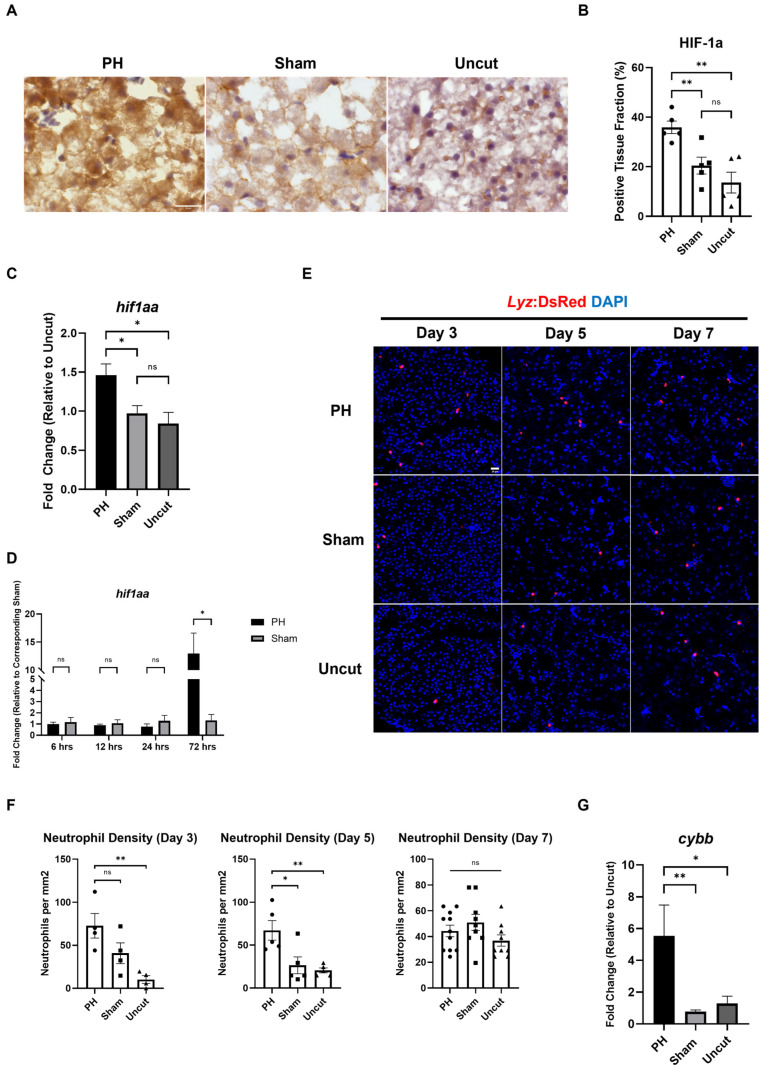
Effects of PH on oxidative stress and neutrophil activity in the kras+ zebrafish liver during the krasG12V-induced development of HCC. (A) IHC staining of HIF1α in PH/sham surgery-treated kras+ livers on Day 5. (B) Quantification of HIF1α-positive liver tissue based on (A) (n = 5). The HIFα positive fraction was determined by measuring the DAB-stained area versus the total tissue area with imageJ plugin color deconvolution. (C) Expression of hif1aa in PH/sham surgery-treated kras+ livers on Day 3 as determined by RT-qPCR (n = 5). (D) Expression of hif1aa in WT male livers within 72 h after PH/sham surgery as determined by RT-qPCR (n = 3). (E) Fluorescence images of PH/sham surgery-treated kras/lyz+ livers following Dox induction. (F) Quantification of DsRed+ neutrophils in the liver based on (E) (n ≥ 4). (G) Expression of cybb in PH/sham surgery-treated kras/lyz+ livers on Day 3 as determined by RT-qPCR (n = 4). Scale Bar = 20 μm. Circles, squares, and triangles in (B,F) indicate values of individual samples. ns p > 0.05, * p ≤ 0.05, ** p ≤ 0.01.

Acknowledgments
This image is the copyrighted work of the attributed author or publisher, and ZFIN has permission only to display this image to its users. Additional permissions should be obtained from the applicable author or publisher of the image. Full text @ Cancers