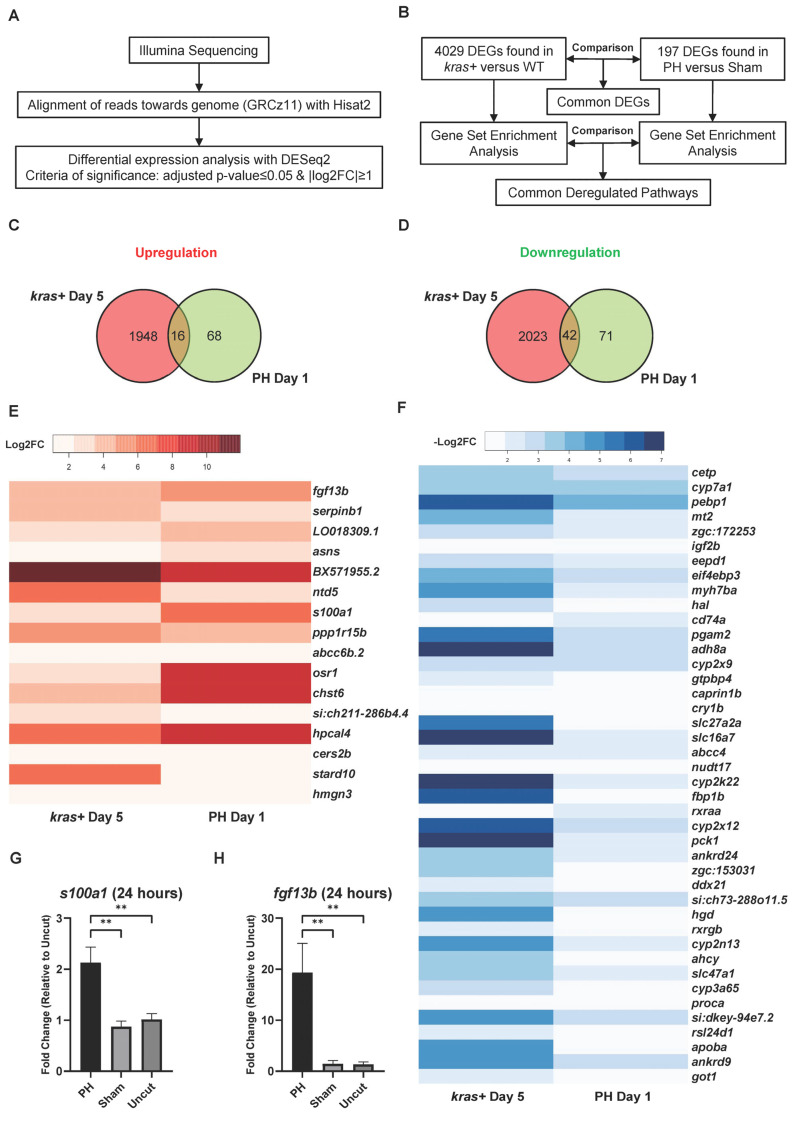
IMAGE

Figure 4

ID
ZDB-IMAGE-240527-88
Source
Figures for Zhu et al., 2024
Image
Figure Caption

Figure 4

Comparison of DEGs during krasG12V-induced HCC development and PH-induced liver regeneration in zebrafish. (A) Workflow of the differential expression analysis based on the RNA-Seq reads. (B) Experimental design for comparing the transcriptomic changes in the kras+ livers with those in the PH livers with the quantification of total DEGs. (C,D) Venn diagrams showing the overlaps of (C) upregulated genes and (D) downregulated genes between the kras+ male liver on Day 5 and the PH male liver on Day 1. (E,F) Heatmaps of genes that were significantly (A) upregulated and (B) downregulated in both the kras+ liver on Day 5 and the PH liver on Day 1 based RNA-seq data. (G,H) Expression of (G) fgf13b and (H) s100a1 in the kras+ male livers 24 h after PH/sham surgery as determined by RT-qPCR (n = 4). ns p > 0.05, ** p ≤ 0.01.

Acknowledgments
This image is the copyrighted work of the attributed author or publisher, and ZFIN has permission only to display this image to its users. Additional permissions should be obtained from the applicable author or publisher of the image. Full text @ Cancers